20240429 Calibre April 2024 Investor Presentation.pdf
Weekly market report
1. `
Page 1 of 6
Market Review and Outlook QSE Index and Volume
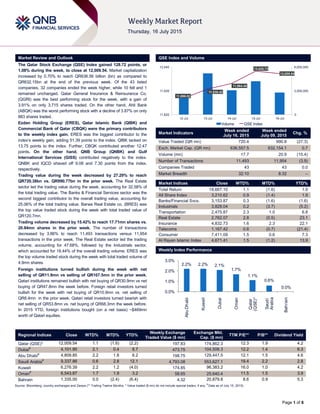
The Qatar Stock Exchange (QSE) Index gained 128.72 points, or
1.08% during the week, to close at 12,009.54. Market capitalization
increased by 0.70% to reach QR636.56 billion (bn) as compared to
QR632.15bn at the end of the previous week. Of the 43 listed
companies, 32 companies ended the week higher, while 10 fell and 1
remained unchanged. Qatar General Insurance & Reinsurance Co.
(QGRI) was the best performing stock for the week, with a gain of
3.91% on only 3,715 shares traded. On the other hand, Ahli Bank
(ABQK) was the worst performing stock with a decline of 3.87% on only
883 shares traded.
Ezdan Holding Group (ERES), Qatar Islamic Bank (QIBK) and
Commercial Bank of Qatar (CBQK) were the primary contributors
to the weekly index gain. ERES was the biggest contributor to the
index’s weekly gain, adding 51.39 points to the index. QIBK tacked on
13.75 points to the index. Further, CBQK contributed another 12.47
points. On the other hand, QNB Group (QNBK) and Gulf
International Services (GISS) contributed negatively to the index.
QNBK and IQCD shaved off 9.08 and 7.30 points from the index,
respectively.
Trading value during the week decreased by 27.29% to reach
QR720.38bn vs. QR990.77bn in the prior week. The Real Estate
sector led the trading value during the week, accounting for 32.58% of
the total trading value. The Banks & Financial Services sector was the
second biggest contributor to the overall trading value, accounting for
25.06% of the total trading value. Barwa Real Estate co. (BRES) was
the top value traded stock during the week with total traded value of
QR120.7mn.
Trading volume decreased by 15.42% to reach 17.71mn shares vs.
20.94mn shares in the prior week. The number of transactions
decreased by 3.86% to reach 11,493 transactions versus 11,954
transactions in the prior week. The Real Estate sector led the trading
volume, accounting for 47.68%, followed by the Industrials sector,
which accounted for 18.44% of the overall trading volume. ERES was
the top volume traded stock during the week with total traded volume of
4.9mn shares.
Foreign institutions turned bullish during the week with net
selling of QR11.9mn vs selling of QR107.5mn in the prior week.
Qatari institutions remained bullish with net buying of QR30.9mn vs net
buying of QR47.8mn the week before. Foreign retail investors turned
bullish for the week with net buying of QR10.9mn vs. net selling of
QR8.4mn in the prior week. Qatari retail investors turned bearish with
net selling of QR53.8mn vs. net buying of QR68.3mn the week before.
In 2015 YTD, foreign institutions bought (on a net basis) ~$469mn
worth of Qatari equities.
Market Indicators
Week ended
July 16, 2015
Week ended
July 09, 2015
Chg. %
Value Traded (QR mn) 720.4 990.8 (27.3)
Exch. Market Cap. (QR mn) 636,557.5 632,154.1 0.7
Volume (mn) 17.7 20.9 (15.4)
Number of Transactions 11,493 11,954 (3.9)
Companies Traded 43 43 0.0
Market Breadth 32:10 8:32 –
Market Indices Close WTD% MTD% YTD%
Total Return 18,667.10 1.1 (1.6) 1.9
All Share Index 3,210.62 0.9 (1.4) 1.9
Banks/Financial Svcs. 3,153.87 0.3 (1.6) (1.6)
Industrials 3,828.04 0.2 (3.7) (5.2)
Transportation 2,475.87 2.3 1.0 6.8
Real Estate 2,762.07 2.8 (0.5) 23.1
Insurance 4,832.73 1.6 2.3 22.1
Telecoms 1,167.42 0.6 (0.7) (21.4)
Consumer 7,411.09 1.5 0.6 7.3
Al Rayan Islamic Index 4,671.41 1.5 (1.2) 13.9
Market Indices
Weekly Index Performance
Regional Indices Close WTD% MTD% YTD%
Weekly Exchange
Traded Value ($ mn)
Exchange Mkt.
Cap. ($ mn)
TTM P/E** P/B** Dividend Yield
Qatar (QSE)* 12,009.54 1.1 (1.6) (2.2) 197.83 174,862.3 12.3 1.9 4.2
Dubai#
4,101.90 2.1 0.4 8.7 473.75 104,508.3 12.2 1.4 6.3
Abu Dhabi#
4,809.85 2.2 1.8 6.2 198.75 129,447.5 12.1 1.5 4.6
Saudi Arabia#
9,337.86 0.6 2.8 12.1 4,793.08 553,627.1 19.4 2.2 2.8
Kuwait 6,276.39 2.2 1.2 (4.0) 174.85 96,383.2 16.0 1.0 4.2
Oman#
6,543.87 1.7 1.9 3.2 58.65 25,640.4 11.5 1.5 3.9
Bahrain 1,335.00 0.0 (2.4) (6.4) 4.32 20,879.8 8.6 0.9 5.3
Source: Bloomberg, country exchanges and Zawya (** Trailing Twelve Months; * Value traded ($ mn) do not include special trades, if any;
#
Data as of July 15, 2015)
11,896.02
11,938.42
11,964.45
12,020.73
12,009.54
0
3,000,000
6,000,000
11,820
11,930
12,040
12-Jul 13-Jul 14-Jul 15-Jul 16-Jul
Volume QSE Index
2.2% 2.2% 2.1%
1.7%
1.1%
0.6%
0.0%
0.0%
1.0%
2.0%
3.0%
AbuDhabi
Kuwait
Dubai
Oman
Qatar
(QSE)*
Saudi
Arabia
Bahrain
2. Page 2 of 6
News
Market & Corporate News
DHBK net profit dips in 2Q2015 to QR381mn falling short of
expectations – Doha bank’s (DHBK) net profit declined 9.3%
QoQ (down 1.7% YoY) to QR381.3mn in 2Q2015. A decline in
the bank’s net interest income by 1.3% QoQ (+2.1% YoY) to
QR500.3mn and net fee & commission income by 2.5% QoQ (-
15.6% YoY) to QR115.7 primarily led the dip in profit. Earnings
per share (EPS) amounted to QR1.47 in 2Q2015 as compared
to QR1.63 in 1Q2015. The bank’s total assets increased 9.6%
YTD to QR82.7bn. Loans & advances to customers registered
a growth of 9.3% YTD to QR53.1bn, while the customer
deposits climbed 12.6% from December-end to QR51.7bn.
(QSE)
CBQK bottom-line surges 26.5% to QR572.3mn in 2Q2015
beating our estimates and consensus estimates by wide
margin – Commercial Bank’s (CBQK) bottom-line surged
26.5% QoQ (up 16.8% YoY) to QR572.3mn in 2Q2015. The
bank’s net fee & commission income jumped 28.6% QoQ
(+8.0% YoY) to QR292.8mn while other operating income
soared 233.0% QoQ (+268.1% YoY) to QR102.6mn, which
aided net profit growth. On the other hand, net interest income
rose slightly by 0.2% QoQ (-4.0% YoY) to QR626.8mn in
2Q2015. As a result, net operating income jumped 17.9% QoQ
(up 5.9% YoY) to QR1.12bn. Earnings per share (EPS) stood at
QR1.66 in 2Q2015 versus QR1.29 in 1Q2015. CBQK’s total
assets reached QR119.1bn, indicating an increase of 3.0%
YTD in 2Q2015. Loans & advances grew marginally from
December 2014-end to QR72.6bn while the customer deposits
registered a growth of 4.2% YTD to QR64.1bn. The bank’s non-
performing loan (NPL) ratio reduced to 3.4% as of June 2015-
end versus 4.12% at the end of June 2014, consequent to the
settlement of a large real estate NPL. The coverage ratio stood
at 86.7%. CBQK’s CEO Abdulla Saleh Al-Raisi said that the
bank has begun a program of exiting non-core real estate
investments, which will be concluded by the end of 1Q2016, as
it increases its focus on core income returns. (QSE, Gulf-
Times.com)
KCBK 2Q2015 net profit expands on higher net interest
income and fee & commissions – Al Khalij Commercial Bank
(KCBK) reported a net profit of QR158.0mn in 2Q2015 vs. our
estimate of QR151.2mn, slightly ahead by 4.5%. Net profit
increased by 9.4% QoQ (+5.6% YoY). The bank’s net interest
income grew 5.0% QoQ (+16.8% YoY) to QR232.0mn. KCBK’s
NIMs remained stable at 1.83% vs. 1.84% in 1Q2015. Fees &
commissions jumped by 12.1% QoQ (+14.0% YoY) to
QR50.7mn. Net loans exhibited subdued performance,
declining by 0.9% QoQ (+10.6% YTD) to QR29.74bn. On the
other hand customer deposits increased by 4.0% QoQ (+8.1%
YTD) to QR29.68bn. KCBK’s NPL ratio stood at 0.8% as of
1H2015 versus 1.35% at the end of 4Q2014. The bank’s capital
adequacy ratio stood at 15.1% in 1H2015. (Company
Financials, QNBFS Research)
QIIK posts healthy bottom-line growth in 2Q2015 – Qatar
International Islamic Bank’s (QIIK) reported net income of
QR225.8mn vs. our estimate of 210.2mn. The beat was due to
the bank reporting provision reversals. Net income gained by
6.4% QoQ (up 14.1% YoY) to QR225.8mn in 2Q2015, helped
by net interest & investment income and reversal in provisions.
QIIK posted Net interest & investment income of QR258.55mn
(in-line with our estimate of QR254.96mn), up 5.6% QoQ
(+3.8% YoY). QIIK’s total assets amounted to QR38.5bn in
2Q2015, rising marginally by 0.3% YTD. The bank’s financing
assets increased by 9.2% YTD to QR23.9bn. However, the
customer deposits fell 3.7% YTD to QR25.6bn. QIIK CEO
Abdulbasit Ahmed Al-Shaibei said non-performing funding
assets amounted to less than 1.57% as the bank continued with
its outstanding record in maintaining the operating efficiency at
23.3%. He added that QIIK is expected to officially open a
branch at the Ezdan Mall within a short period of time, in
addition to several other branches before the end of 2015 in
order to effectively meet the needs of new and existing
customers and the growing demand for its banking services.
The bank’s capital adequacy ratio under Basel III reached
17.53%. (Company Financials, Gulf-Times.com)
Nakilat net profit jumps 20.4% QoQ to QR267.8mn in
2Q2015; reported results in line with our estimate of
QR259.0 with a 3% divergence – Qatar Gas Transport
Company (Nakilat) reported a net profit of QR267.8mn in
2Q2015, surging 20.4% QoQ (up 12.3% YoY). The company’s
total income rose 5.8% QoQ (up 3.4% YoY) in 2Q2015 to
QR923.8mn while total expenses rose slightly to QR655.7mn
(up 0.8% QoQ & down 1.1% YoY). Earnings per share (EPS)
increased to QR0.49 in 2Q2015 from QR0.40 in 1Q2015.The
company said that the healthy financials are a result of its
strategic development, successful joint ventures and resilience
in the challenging economic climate. Nakilat’s Managing
Director Abdullah Al-Sulaiti said the company has seen
increased profits from its joint ventures, particularly since the
launch of a new vessel in 2Q2015, along with an additional five
vessels that became fully operational. (QSE, Gulf-Times.com)
GWCS posts solid net profit growth in 2Q2015 – Gulf
Warehousing Company (GWCS) reported a net profit of
QR47.3mn vs. our estimate of QR45.08mn, ahead by 4.9%.
Net income grew by a solid 17.1% QoQ and 22.1% YoY in
2Q2015. Qatar’s leading logistics provider earned revenue of
QR209.4mn in 2Q2015, reflecting an increase of 6.7% QoQ
and 15.2% YoY. GWCS said that to support the growth in
projects and in constructed facilities, the board of directors
proposed to increase the company’s capital by 25%, which is
equivalent to 11,890,244 shares, at a nominal value of QR10
per share, and a premium of QR28.50 per share. The proposal
has been approved by the Department of Companies Control at
the Ministry of Economy & Commerce in 2Q2015. The
company also announced that it was in the process of getting
the Ministry of Economy & Commerce to approve a date to
convene an Extraordinary General Assembly Meeting in order
to adopt and ratify this transaction. The date of the assembly
will be announced later. (QSE, Gulf-Times.com)
UDCD net income climbs 12.8% QoQ in 2Q2015 – United
Development Company’s (UDCD) net income expanded 12.8%
QoQ (+14.7% YoY) to QR295.4mn in 2Q2015 as its revenue
surged 53.0% QoQ (-2.0% YoY) to QR611.7mn. Earnings per
share increased to QR0.83 in 2Q2015 from QR0.74 in 1Q2015.
(QSE)
Woqod 2Q2015 earnings surge 28.0% QoQ in 2Q2015 –
Qatar Fuel (Woqod) posted a net profit of QR303.7mn, surging
28.0% QoQ (up 1.0% YoY) in 2Q2015. The growth in the net
profit was majorly contributed by a healthy QoQ top-line
increase. The company’s revenue advanced 13.8% QoQ to
QR3.4mn in 2Q2015. However, it was down by 8.4% YoY.
(QSE, Gulf-Times.com)
3. Page 3 of 6
Qatar Stock Exchange
Top Gainers Top Decliners
Source: Qatar Stock Exchange (QSE) Source: Qatar Stock Exchange (QSE)
Most Active Shares by Value (QR Million) Most Active Shares by Volume (Million)
Source: Qatar Stock Exchange (QSE) Source: Qatar Stock Exchange (QSE)
Investor Trading Percentage to Total Value Traded Net Traded Value by Nationality (QR Million)
Source: Qatar Stock Exchange (QSE) Source: Qatar Stock Exchange (QSE)
3.9%
3.7% 3.6% 3.5%
3.2%
0.0%
1.5%
3.0%
4.5%
Qatar General
Insurance &
Reinsurance
Ezdan Real
Estate
Zad Holding Aamal United
Development
-3.9%
-1.9%
-1.7%
-0.7% -0.7%
-4.5%
-3.0%
-1.5%
0.0%
Al Ahli Bank Al Khaleej Takaful
Insurance
Gulf International
Services
Mannai Corp. Islamic Holding
Group
120.7
89.0
72.1
56.1
47.9
0.0
50.0
100.0
150.0
Barwa Real
Estate
Ezdan Real
Estate
Gulf
International
Services
QNB Group Industries
Qatar
4.9
2.4
1.3 1.2
0.9
0.0
2.0
4.0
6.0
Ezdan Real
Estate
Barwa Real
Estate
Vodafone Qatar Aamal Gulf International
Services
0%
20%
40%
60%
80%
100%
Buy Sell
44.22%
51.69%
10.48%
6.19%
17.49% 15.97%
27.81% 26.16%
Qatari Individuals Qatari Institutions
Non-Qatari Individuals Non-Qatari Institutions
394
326
417
303
(23)
23
(100) - 100 200 300 400 500
Qatari
Non-Qatari
Net Investment Total Sold Total Bought
4. Page 4 of 6
TECHNICAL ANALYSIS OF THE QSE INDEX
Source: Bloomberg
The QSE Index rose by 1.08% vs. the previous week. Volumes dropped further this week-end, bounced of the 11,800 support level. The Index has been
practically flat over the past month and volumes dropped significantly. To have a healthy bounce, we need an uptick that is accompanied but higher trading
volumes to bring back traders confidence. Technical Indicators are flat; the support and resistance levels are between 11,800 and 12,600, respectively.
DEFINITIONS OF KEY TERMS USED IN TECHNICAL ANALYSIS
RSI (Relative Strength Index) indicator – RSI is a momentum oscillator that measures the speed and change of price movements. The RSI oscillates
between 0 to 100. The index is deemed to be overbought once the RSI approaches the 70 level, indicating that a correction is likely. On the other hand, if
the RSI approaches 30, it is an indication that the index may be getting oversold and therefore likely to bounce back.
MACD (Moving Average Convergence Divergence) indicator – The indicator consists of the MACD line and a signal line. The divergence or the
convergence of the MACD line with the signal line indicates the strength in the momentum during the uptrend or downtrend, as the case may be. When the
MACD crosses the signal line from below and trades above it, it gives a positive indication. The reverse is the situation for a bearish trend.
Candlestick chart – A candlestick chart is a price chart that displays the high, low, open, and close for a security. The ‘body’ of the chart is portion between
the open and close price, while the high and low intraday movements form the ‘shadow’. The candlestick may represent any time frame. We use a one-day
candlestick chart (every candlestick represents one trading day) in our analysis.
Doji candlestick pattern – A Doji candlestick is formed when a security's open and close are practically equal. The pattern indicates indecisiveness, and
based on preceding price actions and future confirmation, may indicate a bullish or bearish trend reversal.
Shooting Star/Inverted Hammer candlestick patterns – These candlestick patterns have a small real body (open price and close price are near to each
other), and a long upper shadow (large intraday movement on the upside). The Shooting Star is a bearish reversal pattern that forms after a rally. The
Inverted Hammer looks exactly like a Shooting Star, but forms after a downtrend. Inverted Hammers represent a potential bullish trend reversal.
5. Page 5 of 6
Source: Bloomberg
Company Name
Price
(July 16)
% Change 5-
Day
% Change
YTD
Market Cap.
QR Million TTM P/E P/B Div. Yield
Qatar National Bank 185.00 (0.54) (13.10) 129,450 11.8 2.3 4.1
Qatar Islamic Bank 109.00 1.96 6.65 25,756 14.7 1.8 3.9
Commercial Bank of Qatar 56.10 2.56 (9.91) 18,324 9.8 1.1 5.7
Doha Bank 53.20 0.38 (6.67) 13,745 10.0 1.1 7.5
Al Ahli Bank 46.00 (3.87) (7.33) 8,359 13.1 2.0 3.0
Qatar International Islamic Bank 79.00 0.51 (3.30) 11,958 13.9 2.3 5.1
Masraf Al Rayan 45.90 0.44 3.85 34,425 16.4 3.4 3.8
Al Khaliji Bank 22.61 0.13 2.54 8,140 13.4 1.4 4.4
National Leasing 20.85 0.97 4.25 1,032 37.2 0.9 4.1
Dlala Holding 27.20 0.37 (18.65) 773 13.7 2.6 N/A
Qatar & Oman Investment 16.05 0.94 4.22 506 16.5 1.5 5.0
Islamic Holding Group 135.00 (0.66) 8.43 540 37.0 9.1 2.2
Banking and Financial Services 253,007
Zad Holding 101.50 3.57 20.83 1,328 12.0 1.6 3.9
Qatar German Co. for Medical Devices 17.05 1.97 67.98 197 N/A 1.2 N/A
Salam International Investment 14.17 1.21 (10.60) 1,620 20.2 1.0 4.2
Medicare Group 184.50 1.37 57.69 5,193 26.4 5.9 1.0
Qatar Cinema & Film Distribution 42.50 1.19 6.25 267 21.4 1.9 2.1
Qatar Fuel 172.10 1.53 (15.76) 14,535 12.7 2.2 5.2
Qatar Meat and Livestock 61.30 0.82 1.49 1,103 20.4 4.3 4.1
Al Meera Consumer Goods 258.90 1.49 29.45 5,178 22.5 4.1 3.5
Consumer Goods and Services 29,421
Qatar Industrial Manufacturing 46.75 (0.43) 7.84 2,222 13.4 1.6 6.4
Qatar National Cement 120.00 0.00 0.00 6,481 15.2 2.4 3.0
Industries Qatar 135.40 0.37 (19.40) 81,917 14.4 2.7 5.2
Qatari Investors Group 52.00 (0.19) 25.60 6,465 27.7 2.8 1.4
Qatar Electricity and Water 221.20 (0.14) 17.97 24,332 15.2 3.7 3.4
Mannai Corp. 110.10 (0.72) 1.01 5,023 9.3 2.4 5.4
Aamal 15.16 3.48 4.79 9,551 15.1 1.3 6.3
Gulf International Services 75.60 (1.69) (22.14) 14,050 8.9 4.0 7.3
Mesaieed Petrochemical Holding 24.00 (0.04) -18.6 30,152 20.9 2.3 4.6
Industrials 180,191
Qatar Insurance 99.90 1.42 26.80 18,444 19.5 3.2 2.2
Doha Insurance 25.70 1.98 (11.38) 1,285 14.5 1.2 3.9
Qatar General Insurance & Reinsurance 55.80 3.91 8.76 4,439 4.9 0.8 3.1
Al Khaleej Takaful Insurance 42.20 (1.86) (4.47) 1,077 14.5 1.7 3.1
Qatar Islamic Insurance 82.00 0.12 3.80 1,230 14.7 4.3 4.9
Insurance 26,475
United Development 24.89 3.24 5.51 8,813 12.9 0.8 5.0
Barw a Real Estate 50.80 0.79 21.24 19,768 3.2 1.1 4.3
Ezdan Real Estate 18.14 3.66 21.58 48,116 35.1 1.6 2.2
Mazaya Qatar Real Estate Development 18.69 2.41 2.48 1,962 11.3 1.5 1.5
Real Estate 78,659
Qatar Telecom 85.40 0.12 (31.07) 27,355 15.7 1.3 4.7
Vodafone Qatar 16.57 1.66 0.73 14,008 N/A 2.5 1.3
Telecoms 41,364
Qatar Navigation (Milaha) 98.10 2.19 (1.41) 11,235 10.5 0.9 5.6
Gulf Warehousing 75.80 2.43 34.40 3,605 22.5 4.3 2.0
Qatar Gas Transport (Nakilat) 22.50 2.27 (2.60) 12,600 13.2 3.2 5.3
Transportation 27,440
Qatar Exchange 636,558
6. Contacts
Saugata Sarkar Sahbi Kasraoui QNB Financial Services SPC
Head of Research Head of HNI Contact Center: (+974) 4476 6666
Tel: (+974) 4476 6534 Tel: (+974) 4476 6544 PO Box 24025
saugata.sarkar@qnbfs.com.qa sahbi.alkasraoui@qnbfs.com.qa Doha, Qatar
Disclaimer and Copyright Notice: This publication has been prepared by QNB Financial Services SPC (“QNBFS”) a wholly-owned subsidiary of QNB SAQ (“QNB”). QNBFS is regulated by the
Qatar Financial Markets Authority and the Qatar Exchange QNB SAQ is regulated by the Qatar Central Bank. This publication expresses the views and opinions of QNBFS at a given time only. It is
not an offer, promotion or recommendation to buy or sell securities or other investments, nor is it intended to constitute legal, tax, accounting, or financial advice. QNBFS accepts no liability
whatsoever for any direct or indirect losses arising from use of this report. Any investment decision should depend on the individual circumstances of the investor and be based on specifically
engaged investment advice. We therefore strongly advise potential investors to seek independent professional advice before making any investment decision. Although the information in this report
has been obtained from sources that QNBFS believes to be reliable, we have not independently verified such information and it may not be accurate or complete. QNBFS does not make any
representations or warranties as to the accuracy and completeness of the information it may contain, and declines any liability in that respect. For reports dealing with Technical Analysis,
expressed opinions and/or recommendations may be different or contrary to the opinions/recommendations of QNBFS Fundamental Research as a result of depending solely on the historical
technical data (price and volume). QNBFS reserves the right to amend the views and opinions expressed in this publication at any time. It may also express viewpoints or make investment
decisions that differ significantly from, or even contradict, the views and opinions included in this report. This report may not be reproduced in whole or in part without permission from QNBFS
COPYRIGHT: No part of this document may be reproduced without the explicit written permission of QNBFS.
Page 6 of 6