VVIP Pune Call Girls Katraj (7001035870) Pune Escorts Nearby with Complete Sa...
Weekly market report
1. Page 1 of 5
Market Review and Outlook QE Index and Volume
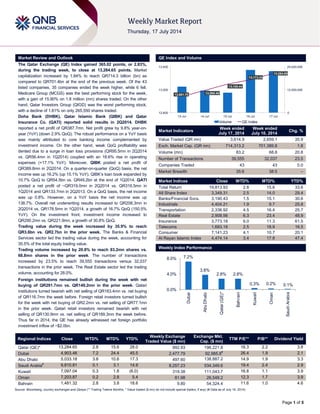
The Qatar Exchange (QE) Index gained 365.02 points, or 2.83%,
during the trading week, to close at 13,284.65 points. Market
capitalization increased by 1.84% to reach QR714.3 billion (bn) as
compared to QR701.4bn at the end of the previous week. Of the 43
listed companies, 35 companies ended the week higher, while 6 fell.
Medicare Group (MCGS) was the best performing stock for the week,
with a gain of 15.90% on 1.8 million (mn) shares traded. On the other
hand, Qatar Investors Group (QIGD) was the worst performing stock,
with a decline of 1.61% on only 265,550 shares traded.
Doha Bank (DHBK), Qatar Islamic Bank (QIBK) and Qatar
Insurance Co. (QATI) reported solid results in 2Q2014. DHBK
reported a net profit of QR387.7mn. Net profit grew by 9.8% year-on-
year (YoY) (down 2.9% QoQ). The robust performance on a YoY basis
was mainly attributed to core banking income complemented by
investment income. On the other hand, weak QoQ profitability was
dented due to a surge in loan loss provisions (QR95.5mn in 2Q2014
vs. QR56.4mn in 1Q2014) coupled with an 18.6% rise in operating
expenses (+17.1% YoY). Moreover, QIBK posted a net profit of
QR389.8mn in 2Q2014. On a quarter-on-quarter (QoQ) basis, the net
income was up 16.2% (up 15.1% YoY). QIBK’s loan book expanded by
10.7% QoQ to QR54.5bn vs. QR49.2bn at the end of 1Q2014. QATI
posted a net profit of ~QR319.0mn in 2Q2014 vs. QR316.5mn in
1Q2014 and QR133.7mn in 2Q2013. On a QoQ basis, the net income
was up 0.8%. However, on a YoY basis the net income was up
138.7%. Overall net underwriting results increased to QR208.3mn in
2Q2014 vs. QR178.5mn in 1Q2014, a growth of 16.7% QoQ (150.5%
YoY). On the investment front, investment income increased to
QR290.2mn vs. QR221.9mn, a growth of 30.8% QoQ.
Trading value during the week increased by 35.9% to reach
QR3.6bn vs. QR2.7bn in the prior week. The Banks & Financial
Services sector led the trading value during the week, accounting for
35.5% of the total equity trading value.
Trading volume increased by 20.8% to reach 83.2mn shares vs.
68.8mn shares in the prior week. The number of transactions
increased by 23.5% to reach 39,555 transactions versus 32,037
transactions in the prior week. The Real Estate sector led the trading
volume, accounting for 28.0%.
Foreign institutions remained bullish during the week with net
buying of QR291.7mn vs. QR149.2mn in the prior week. Qatari
institutions turned bearish with net selling of QR163.4mn vs. net buying
of QR116.7mn the week before. Foreign retail investors turned bullish
for the week with net buying of QR2.2mn vs. net selling of QR77.1mn
in the prior week. Qatari retail investors remained bearish with net
selling of QR130.9mn vs. net selling of QR189.3mn the week before.
Thus far in 2014, the QE has already witnessed net foreign portfolio
investment inflow of ~$2.0bn.
Market Indicators
Week ended
July 17, 2014
Week ended
July 10, 2014
Chg. %
Value Traded (QR mn) 3,614.9 2,659.1 35.9
Exch. Market Cap. (QR mn) 714,313.2 701,389.8 1.8
Volume (mn) 83.2 68.8 20.8
Number of Transactions 39,555 32,037 23.5
Companies Traded 43 43 0.0
Market Breadth 35:6 38:5 –
Market Indices Close WTD% MTD% YTD%
Total Return 19,813.93 2.8 15.6 33.6
All Share Index 3,349.31 2.5 14.0 29.4
Banks/Financial Svcs. 3,190.43 1.5 15.1 30.6
Industrials 4,404.21 1.9 9.7 25.8
Transportation 2,336.92 4.5 16.4 25.7
Real Estate 2,908.56 6.3 23.4 48.9
Insurance 3,773.18 6.0 11.3 61.5
Telecoms 1,693.18 2.5 18.9 16.5
Consumer 7,141.23 4.1 10.7 20.1
Al Rayan Islamic Index 4,474.14 3.4 17.8 47.4
Market Indices
Weekly Index Performance
Regional Indices Close WTD% MTD% YTD%
Weekly Exchange
Traded Value ($ mn)
Exchange Mkt.
Cap. ($ mn)
TTM P/E** P/B** Dividend Yield
Qatar (QE)* 13,284.65 2.8 15.6 28.0 992.93 196,221.8 16.3 2.2 3.8
Dubai 4,903.46 7.2 24.4 45.5 2,477.79 92,985.8#
26.4 1.9 2.1
Abu Dhabi 5,033.18 3.8 10.6 17.3 497.60 138,887.2 14.9 1.9 3.3
Saudi Arabia#
9,810.81 0.1 3.1 14.9 8,257.23 534,349.6 19.4 2.4 2.9
Kuwait 7,097.04 0.3 1.8 (6.0) 319.38 111,043.7 16.8 1.1 3.9
Oman 7,203.87 0.2 2.8 5.4 81.98 26,548.2 12.3 1.7 3.9
Bahrain 1,481.32 2.8 3.8 18.6 9.80 54,324.4 11.6 1.0 4.6
Source: Bloomberg, country exchanges and Zawya (** Trailing Twelve Months; * Value traded ($ mn) do not include special trades, if any) (# Data as of July 16, 2014)
12,881.70 12,990.40
13,100.44
13,173.34
13,284.65
0
12,500,000
25,000,000
12,600
13,000
13,400
13-Jul 14-Jul 15-Jul 16-Jul 17-Jul
Volume QE Index
7.2%
3.8%
2.8% 2.8%
0.3% 0.2% 0.1%
0.0%
4.0%
8.0%
Dubai
AbuDhabi
Qatar(QE)*
Bahrain
Kuwait
Oman
SaudiArabia
2. Page 2 of 5
News
Market & Corporate News
DHBK 2Q2014 YoY profitability driven on the back of core
banking income aided by investment income – DHBK
reported a net profit of QR387.7mn, broadly inline with our
estimate of QR384.3mn (BBG consensus: QR375.8mn and
Reuters consensus: QR380.4mn). Net profit grew by 9.8% YoY
(down 2.9% QoQ). The robust performance on a YoY basis
was mainly attributed to core banking income complimented by
investment income. DHBK posted a net interest income of
QR490.1mn, increasing by 5.6% YoY (+1.0% QoQ). The bank’s
annualized NIM continued to remain under pressure (3.0% in
2Q2014 vs. 3.09% in 1Q2014). Moreover fees and
commissions surged by 35.1% YoY (+44.3% QoQ) reaching
QR137.1mn. On the other hand, weak QoQ profitability was
dented due to a surge in loan loss provisions (QR95.5mn in
2Q2014 vs. QR56.4mn in 1Q2014) coupled with an 18.6% rise
in operating expenses (+17.1% YoY). Doha Bank’s loans and
deposits grew by 10.2% (+4.4% QoQ) and 4.6% (+2.3% QoQ)
YTD, respectively. Thus, Doha Bank’s LDR rested at 102% at
the end of 2Q2014 vs. 100% at the end of 1Q2014 (97% at the
end of 2013). On the other hand, the bank’s investment
portfolio receded by 2.4% QoQ (down 16.1% YTD). (QNBFS,
QE)
QIBK 2Q2014 net profit results beat estimates – QIBK
posted a net profit (to equity) of QR389.8mn in 2Q2014 vs.
BBG consensus estimate of QR351.6mn (Reuters
QR348.8mn). On a QoQ basis, the net income is up 16.2% (up
15.1% YoY). QIBK’s loan book expanded by 10.7% QoQ to
QR54.5bn vs. QR49.2bn at the end of 1Q2014. However,
equity of unrestricted investment account holders (URIA)
jumped by 5.7% QoQ to QR 47.0bn vs. QR44.5bn (term
deposits stand at QR32.3bn vs. QR28.9bn at the end of
1Q2014). We note that customers deposits in current accounts
increased by only 0.6% QoQ (QR14.3bn vs. QR 14.2bn).
Hence, the loan-to-deposit ratio jumped to 88.9% vs. 83.8%
(93.6% at the end of 2013). Thus, net interest income increased
to QR423.1mn (up 4.0% QoQ). In terms of the investment
book, total investments increased by 28.7% QoQ (after a
decline of 20.0% QoQ in 1Q2014). The growth came from debt
securities, especially the State of Qatar debt, which increased
by 38.9% QoQ (it declined by 28.2% QoQ in 1Q2014). This led
to a 21.0% QoQ growth in investment income and was the
primary driver for the bottom-line growth in the 2nd
quarter. (QNBFS, QE)
QGTS 2Q2014 profit beats estimate driven by JV income –
Nakilat reported 2Q2014 results with: (1) Revenue from wholly-
owned vessels just 1% shy of our estimate at QR752mn (+1%
QoQ and YoY). (2) Share of operating profits from JVs gained
significantly to a record level of QR116mn (+43% QoQ, +61%
YoY) driven by significant gains in LPG shipping rates beyond
our expectations and expansion of the jointly-held LNG fleet
(through the Maran Nakilat JV) in line with our model. The
shipyard business, while small, also continues to show traction
on a YoY basis. (3) Adjusted EBITDA of QR705mn (+5% QoQ,
+6% YoY) was around 5% above our estimate of QR670mn. (4)
Net income, before appropriations, of QR238mn (+15% QoQ,
+31% YoY) was also impacted by QR8mn in gains from
derivative instruments in JVs, which we do not model.
Excluding this, net income was 16% greater than our estimate
of QR199mn. (QNBFS, QE)
QEWS, generally in-line 2Q2014 earnings with
maintenance-related top-line miss offset by one-off
income. Reported net income for quarter came in at
QR416.5mn (+39% QoQ, -4% YoY), just 2.1% above our
estimate (QR408.0mn). Reuters consensus was at QR422.7mn
but with wide divergences in the other estimates (QR389.3mn
and QR470.7mn). Reported revenue was 4.5% lower than our
estimate of QR815.7mn at QR779.4mn (18% QoQ, -1 YoY)
with maintenance-related shutdowns at RAF B2/A1 early on in
2Q2014 impacting mostly power sales. Reported revenue was
comprised of: (1) QR431.2mn in electricity revenue (+31%
QoQ, -2% YoY), which was below our estimate; (2) QR299.6mn
in water desalination sales (+4% QoQ, +2% YoY) also fell
below our estimate but moderately; and (3) QR48.5mn in lease
income (+16% QoQ, -2% YoY) that was in line with our
modeled expectation. Seasonal uptick in revenue benefited
margins sequentially, with the gross margin increasing to 59.9%
vs. 55.3% in 1Q2014; GMs dipped below the 63.6% level
posted in 2Q2013, however. EBITDA came in at QR410.5mn
(+30% QoQ, -8% YoY) increasing the EBITDA margin to 52.7%
vs. 47.8% in 1Q2014 (56.6% in 2Q2014). According to
management, 2Q2014 profitability was helped by ~QR51mn in
claims settlements. Finally, share of profits from JVs (Q Power,
Mesaieed Power & RGPC) was QR102.4mn (+21% QoQ, +1%
YoY) which was right in line with our estimate. (QNBFS, QE)
QATI posts a strong set of results, to set up subsidiary in
Malta – Strong performance in 2Q2014: Qatar Insurance
(QATI) posted a net profit of ~QR319.0mn in 2Q2014 vs.
QR316.5mn in 1Q2014 and QR133.7mn in 2Q2013. On a QoQ
basis, the net income was up 0.8%. However, on a YoY basis
the net income was up 138.7%. 2Q2014 analysis: QATI’s gross
written premium (GWP) stood at QR2.1bn vs. QR1.1bn (growth
of 88.2% QoQ and 114.8% YoY). Overall net underwriting
results increased to QR208.3mn in 2Q2014 vs. QR178.5mn in
1Q2014, a growth of 16.7% QoQ (150.5% YoY). On the
investment front, investment income increased to QR290.2mn
vs. QR221.9mn, a growth of 30.8% QoQ. We believe the strong
performance of regional equity markets allowed the firm to post
a strong show despite the absence of dividends in the second
quarter. This lead to total income reaching QR532.8mn vs.
QR445.5mn, a growth of 19.6% QoQ (134.4% YoY).
Meanwhile, QATI’s board of directors have approved the
issuance of five-year convertible bonds into shares of QATI with
a total value of $250mn, in order to meet the future capital
requirements as well as match the growth rates expected for
the insurance activities over the next few years. (QNBFS, QE)
MCGS posted a net profit of QR47.0mn in 2Q2014, up
124.1% YoY – Medicare Group (MCGS) reported a net profit of
QR81.0mn in 1H2014 as compared to QR45.3mn in 1H2013.
For 2Q2014, the company posted a net income of QR47.0mn
representing a 124.1% YoY growth (+37.8% QoQ basis). The
company’s operating income grew 21.6% YoY to QR134.9mn
in 2Q2014 (+13.5% QoQ basis). (QE)
ABank bond offers pick-up to parent CBQK – Turkey-based
Alternatifbank (ABank) appeared to be offering a 45-55 basis
point pick-up to majority owner Commercial Bank of Qatar
(CBQK) when it set guidance for a new five-year note. The
lender, rated A1/A-/A, set initial price thoughts of 160-170 bps
over mid-swaps on a new Reg S only senior unsecured note
with the deal size expected to be $250mn. CBQK owns a
74.25% stake in ABank. CBQK recently issued a 2.875%, 2019
note that was trading at a Z-spread of 109 bps around the time
of announcement. A new five-year CBQ trade would price
around Z+115 bps, suggesting that the pick-up on offer is
around 45-55 bps. (Reuters)
3. Page 3 of 5
Qatar Exchange
Top 5 Gainers Top 5 Decliners
Source: Qatar Exchange (QE) Source: Qatar Exchange (QE)
Most Active Shares by Value (QR Million) Most Active Shares by Volume (Million)
Source: Qatar Exchange (QE) Source: Qatar Exchange (QE)
Investor Trading Percentage to Total Value Traded Net Traded Value by Nationality (QR Million)
Source: Qatar Exchange (QE) Source: Qatar Exchange (QE)
15.9%
9.5% 9.1% 8.7% 8.3%
0.0%
6.0%
12.0%
18.0%
Medicare
Group
Doha
Insurance
Gulf
International
Services
Dlala Holding Barwa Real
Estate
-1.6%
-1.5% -1.5%
-0.5% -0.5%
-1.8%
-1.3%
-0.8%
-0.3%
Qatari Investors
Group
Zad Holding Qatar German
Co. for Medical
Devices
Ezdan Real
Estate
Mannai Corp.
430.8 430.7
217.1
196.5
174.2
0.0
150.0
300.0
450.0
Barwa Real
Estate
Masraf Al
Rayan
Vodafone
Qatar
QNB Group Gulf
International
Services
10.9
10.0
7.8 7.8
6.6
0.0
4.0
8.0
12.0
Vodafone Qatar Barwa Real
Estate
Salam
International
Investment
Masraf Al Rayan Qatar Gas
Transport
(Nakilat)
0%
20%
40%
60%
80%
100%
Buy Sell
48.32% 51.94%
15.32%
19.84%
16.13%
16.07%
20.23%
12.16%
Qatari Individuals Qatari Institutions
Non-Qatari Individuals Non-Qatari Institutions
2,301
1,314
2,595
1,020
(294)
294
(500) - 500 1,000 1,500 2,000 2,500 3,000
Qatari
Non-Qatari
Net Investment Total Sold Total Bought
4. Page 4 of 5
TECHNICAL ANALYSIS OF THE QE INDEX
Source: Bloomberg
The QE Index extended its rally for the third straight week and ended gaining around 365 points to close near the 13,300.0 psychological level. The index
made a weak start to the week, but gained momentum in the remaining trading sessions as it rose in four out of the five sessions. This has helped the index
to climb above its important psychological levels of 13,000.0, 13,100.0 and 13,200.0. Meanwhile, the index has been in upmove mode and is registering
strong gains over the past few days. We believe the index may continue its bullish momentum and proceed toward the 13,350.0 -13,400.0 levels. This is an
important level to watch out for traders as any move above these levels may see the bulls go berserk and push the index to test the 13,550.0-13,600.0
levels. Further, both the momentum indicators are providing bullish signals and are showing no immediate trend reversal signs indicating that the index may
continue its acceleration. On the flip side, any failure to move above the 13,350.0-13,400.0 levels may result in a range-bound move. Traders may need to
keep a close watch on the support near 13,200.0 as any retreat below this level may drag the index to test the 13,080.0 level. Thus, traders may continue to
remain bullish, but are advised to follow the support levels.
DEFINITIONS OF KEY TERMS USED IN TECHNICAL ANALYSIS
RSI (Relative Strength Index) indicator – RSI is a momentum oscillator that measures the speed and change of price movements. The RSI oscillates
between 0 to 100. The index is deemed to be overbought once the RSI approaches the 70 level, indicating that a correction is likely. On the other hand, if
the RSI approaches 30, it is an indication that the index may be getting oversold and therefore likely to bounce back.
MACD (Moving Average Convergence Divergence) indicator – The indicator consists of the MACD line and a signal line. The divergence or the
convergence of the MACD line with the signal line indicates the strength in the momentum during the uptrend or downtrend, as the case may be. When the
MACD crosses the signal line from below and trades above it, it gives a positive indication. The reverse is the situation for a bearish trend.
Candlestick chart – A candlestick chart is a price chart that displays the high, low, open, and close for a security. The ‘body’ of the chart is portion between
the open and close price, while the high and low intraday movements form the ‘shadow’. The candlestick may represent any time frame. We use a one-day
candlestick chart (every candlestick represents one trading day) in our analysis.
Doji candlestick pattern – A Doji candlestick is formed when a security's open and close are practically equal. The pattern indicates indecisiveness, and
based on preceding price actions and future confirmation, may indicate a bullish or bearish trend reversal.
Shooting Star/Inverted Hammer candlestick patterns – These candlestick patterns have a small real body (open price and close price are near to each
other), and a long upper shadow (large intraday movement on the upside). The Shooting Star is a bearish reversal pattern that forms after a rally. The
Inverted Hammer looks exactly like a Shooting Star, but forms after a downtrend. Inverted Hammers represent a potential bullish trend reversal.
5. Contacts
Saugata Sarkar Abdullah Amin, CFA Shahan Keushgerian
Head of Research Senior Research Analyst Senior Research Analyst
Tel: (+974) 4476 6534 Tel: (+974) 4476 6569 Tel: (+974) 4476 6509
saugata.sarkar@qnbfs.com.qa abdullah.amin@qnbfs.com.qa shahan.keushgerian@qnbfs.com.qa
Sahbi Kasraoui Ahmed Al-Khoudary QNB Financial Services SPC
Manager – HNWI Head of Sales Trading – Institutional Contact Center: (+974) 4476 6666
Tel: (+974) 4476 6544 Tel: (+974) 4476 6548 PO Box 24025
sahbi.alkasraoui@qnbfs.com.qa ahmed.alkhoudary@qnbfs.com.qa Doha, Qatar
DISCLAIMER: This publication has been prepared by QNB Financial Services SPC (“QNBFS”) a wholly-owned subsidiary of Qatar National Bank (“QNB”). QNBFS is regulated by the Qatar
Financial Markets Authority and the Qatar Exchange; QNB is regulated by the Qatar Central Bank. This publication expresses the views and opinions of QNBFS at a given time only. It is not an
offer, promotion or recommendation to buy or sell securities or other investments, nor is it intended to constitute legal, tax, accounting, or financial advice. We therefore strongly advise potential
investors to seek independent professional advice before making any investment decision. Although the information in this report has been obtained from sources that QNBFS believes to be
reliable, we have not independently verified such information and it may not be accurate or complete. While this publication has been prepared with the utmost degree of care by our analysts,
QNBFS does not make any representations warranties as to the accuracy and completeness of the information it may contain, and declines any liability in that respect. QNBFS reserves the right
to amend the views and opinions expressed in this publication at any time. It may also express viewpoints or make investment decisions that differ significantly from, or even contradict, the views
and opinions included in this report.
COPYRIGHT: No part of this document may be reproduced without the explicit written permission of QNBFS.
Page 5 of 5
Source: Bloomberg
Com pany Nam e
Price
(July 17)
% Change
5-Day
% Change
YTD
Market Cap.
QR Million TTM P/E P/B Div. Yield
Qatar National Bank 177.30 0.17 3.08 124,062 12.6 2.4 3.9
Qatar Islamic Bank 108.00 6.93 56.52 25,520 18.0 2.2 3.7
Commercial Bank of Qatar 70.70 3.36 19.83 20,993 12.9 1.3 2.4
Doha Bank 59.70 2.93 2.58 15,425 10.8 1.5 7.5
Al Ahli Bank 52.90 0.95 25.04 8,739 15.7 2.2 N/A
Qatar International Islamic Bank 86.90 0.00 40.84 13,154 17.1 2.7 4.3
Masraf Al Rayan 55.20 0.18 76.36 41,400 23.9 4.2 2.7
Al Khaliji Bank 22.50 0.00 12.56 8,100 15.3 1.5 4.4
National Leasing 31.55 0.16 4.64 1,561 24.9 1.3 4.8
Dlala Holding 57.50 8.70 160.18 1,277 16.2 5.0 N/A
Qatar & Oman Investment 15.69 3.16 25.32 494 22.7 1.5 3.8
Islamic Holding Group 70.80 0.14 53.91 283 23.3 4.8 2.4
Banking and Financial Services 261,008
Zad Holding 81.00 (1.46) 16.55 1,060 9.9 0.7 4.3
Qatar German Co. for Medical Devices 14.14 (1.46) 2.09 163 N/M 0.9 N/A
Salam International Investment 19.55 3.99 50.27 2,235 17.4 1.4 5.1
Medicare Group 101.30 15.90 92.95 2,851 22.7 3.8 1.8
Qatar Cinema & Film Distribution 51.90 3.80 29.43 296 25.8 2.1 N/A
Qatar Fuel 220.00 2.61 0.67 18,581 15.4 3.2 3.5
Qatar Meat and Livestock 57.00 1.79 10.25 1,026 19.2 3.8 3.7
Al Meera Consumer Goods 184.50 5.13 38.41 3,690 16.8 2.9 4.3
Consum er Goods and Services 29,902
Qatar Industrial Manufacturing 46.55 1.42 10.40 2,212 10.6 1.5 N/A
Qatar National Cement 138.00 1.47 15.97 6,776 15.1 2.8 4.3
Industries Qatar 180.80 0.56 7.05 109,384 15.5 3.8 6.1
Qatari Investors Group 55.10 (1.61) 26.09 6,850 30.3 3.3 1.4
Qatar Electricity and Water 187.90 1.02 13.63 20,669 14.1 3.5 3.6
Mannai Corp. 109.90 (0.45) 22.25 5,014 9.9 2.8 5.0
Aamal 16.72 1.03 11.47 10,032 19.0 1.4 N/A
Gulf International Services 111.80 9.07 129.10 20,777 28.5 7.0 1.4
Mesaieed Petrochemical Holding 32.45 1.25 N/A 40,768 N/A 3.0 1.1
Industrials 222,481
Qatar Insurance 90.00 6.51 69.17 14,449 14.7 2.7 2.2
Doha Insurance 27.65 9.50 10.60 1,383 10.3 1.3 7.2
Qatar General Insurance & Reinsurance 46.00 2.22 15.24 3,182 1.5 0.7 2.7
Al Khaleej Takaful Insurance 47.80 7.54 70.25 1,061 12.4 1.6 N/A
Qatar Islamic Insurance 81.10 4.65 40.07 1,217 15.9 4.7 4.6
Insurance 21,291
United Development 26.45 4.13 22.83 9,366 20.2 0.9 3.6
Barw a Real Estate 44.95 8.31 50.84 17,491 11.8 1.2 4.4
Ezdan Real Estate 23.49 (0.47) 38.18 62,307 50.0 2.1 1.3
Mazaya Qatar Real Estate Development 19.10 (0.21) 70.84 1,910 12.4 1.6 3.9
Real Estate 91,074
Qatar Telecom 137.50 1.48 0.22 44,044 16.9 1.7 2.9
Vodafone Qatar 20.45 5.96 90.94 17,288 N/M 2.9 0.8
Telecom s 61,332
Qatar Navigation (Milaha) 99.30 1.64 19.64 11,372 11.8 0.9 5.0
Gulf Warehousing 51.90 2.77 25.06 2,468 22.4 3.2 2.9
Qatar Gas Transport (Nakilat) 23.90 7.17 18.02 13,384 16.2 3.6 4.6
Transportation 27,225
Qatar Exchange 714,313