QNBFS Weekly Market Report February 10, 2022
•
0 likes•105 views

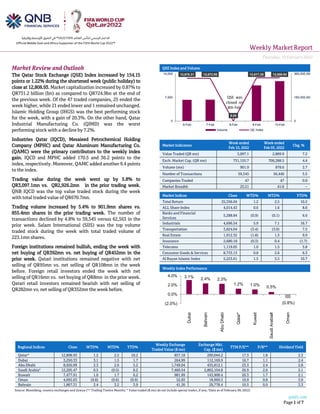
The Qatar Stock Exchange (QSE) Index increased by 154.15 points or 1.22% during the shortened week (public holiday) to close at 12,808.93

More Related Content
What's hot
What's hot (20)
Similar to QNBFS Weekly Market Report February 10, 2022
Similar to QNBFS Weekly Market Report February 10, 2022 (20)
More from QNB Group
More from QNB Group (20)
Recently uploaded
Recently uploaded (20)
QNBFS Weekly Market Report February 10, 2022
- 1. Weekly MarketReport Thursday,10February2022 qnbfs.com Page 1 of 7 Regional Indices Close WTD% MTD% YTD% Weekly Exchange Traded Value ($ mn) Exchange Mkt. Cap. ($ mn) TTM P/E** P/B** Dividend Yield Qatar* 12,808.93 1.2 2.5 10.2 857.18 200,044.2 17.3 1.8 2.3 Dubai 3,250.33 3.1 1.5 1.7 264.99 112,169.9 16.7 1.1 2.4 Abu Dhabi 8,926.99 2.3 2.6 5.2 1,749.04 435,812.1 23.3 2.4 2.8 Saudi Arabia# 12,205.47 0.5 (0.5) 8.2 7,460.54 2,802,104.8 26.9 2.6 2.1 Kuwait 7,477.91 1.0 1.7 6.2 981.99 143,908.4 20.3 1.7 2.1 Oman 4,092.63 (0.8) (0.6) (0.9) 52.83 18,969.3 10.9 0.8 3.9 Bahrain 1,867.31 2.4 3.2 3.9 41.26 29,778.4 10.5 0.9 3.3 Source: Bloomberg, country exchanges and Zawya (** Trailing Twelve Months; * Value traded ($ mn) do not include special trades, if any; #Data as of February 09, 2022) Market Review and Outlook QSE Index and Volume The Qatar Stock Exchange (QSE) Index increased by 154.15 points or 1.22% during the shortened week (public holiday) to close at 12,808.93. Market capitalization increased by 0.87% to QR731.2 billion (bn) as compared to QR724.9bn at the end of the previous week. Of the 47 traded companies, 25 ended the week higher, while 21 ended lower and 1 remained unchanged. Islamic Holding Group (IHGS) was the best performing stock for the week, with a gain of 20.3%. On the other hand, Qatar Industrial Manufacturing Co. (QIMD) was the worst performing stock with a decline by 7.2%. Industries Qatar (IQCD), Mesaieed Petrochemical Holding Company (MPHC) and Qatar Aluminum Manufacturing Co. (QAMC) were the primary contributors to the weekly index gain. IQCD and MPHC added 170.5 and 36.2 points to the index, respectively. Moreover, QAMC added another 9.4 points to the index. Trading value during the week went up by 5.8% to QR3,097.1mn vs. QR2,926.2mn in the prior trading week. QNB IQCD was the top value traded stock during the week with total traded value of QR670.7mn. Trading volume increased by 5.4% to 901.9mn shares vs. 855.4mn shares in the prior trading week. The number of transactions declined by 4.8% to 59,545 versus 62,563 in the prior week. Salam International (SIIS) was the top volume traded stock during the week with total traded volume of 223.1mn shares. Foreign institutions remained bullish, ending the week with net buying of QR392mn vs. net buying of QR452mn in the prior week. Qatari institutions remained negative with net selling of QR95mn vs. net selling of QR108mn in the week before. Foreign retail investors ended the week with net selling of QR16mn vs. net buying of QR8mn in the prior week. Qatari retail investors remained bearish with net selling of QR282mn vs. net selling of QR352mn the week before. Market Indicators Week ended Feb 10, 2022 Week ended Feb 03, 2022 Chg. % Value Traded (QR mn) 3,097.1 2,889.9 7.2 Exch. Market Cap. (QR mn) 731,155.7 700,288.5 4.4 Volume (mn) 901.9 878.6 2.7 Number of Transactions 59,545 56,440 5.5 Companies Traded 47 47 0.0 Market Breadth 25:21 41:6 – Market Indices Close WTD% MTD% YTD% Total Return 25,356.04 1.2 2.5 10.2 ALL Share Index 4,014.43 0.6 1.6 8.6 Banks and Financial Services 5,288.84 (0.9) (0.1) 6.6 Industrials 4,696.54 5.9 7.1 16.7 Transportation 3,824.04 (3.4) (3.0) 7.5 Real Estate 1,912.32 (1.8) 1.3 9.9 Insurance 2,680.18 (0.3) 0.4 (1.7) Telecoms 1,119.05 1.0 1.5 5.8 Consumer Goods & Services 8,733.13 0.8 2.6 6.3 Al Rayan Islamic Index 5,223.61 1.5 3.5 10.7 Weekly Index Performance 12,678.31 12,672.95 0.00 12,817.25 12,808.93 0 180,000,000 360,000,000 0 7,000 14,000 6-Feb 7-Feb 8-Feb 9-Feb 10-Feb Volume QE Index QSE was closed on 8th Feb. 3.1% 2.4% 2.3% 1.2% 1.0% 0.5% (0.8%) (2.0%) 0.0% 2.0% 4.0% Dubai Bahrain Abu Dhabi Qatar* Kuwait Saudi Arabia# Oman
- 2. qnbfs.com Page 2 of 7 Economic, Market & Company News Qatar’s budget seen likely to record QR16bn-plus surplus this year – Qatar’s budget for this fiscal is expected to record a surplus of around QR16.5bn (2.3% of GDP), even assuming higher than budgeted expenditure, according to regional banking group Emirates NBD. This, the bank said, is because of its “more optimistic” oil price forecast of $68/barrel for 2022. According to Emirates NBD, Qatar’s revenues are expected to reach to QR196bn, a 22.4% rise compared to last year’s budget estimates. The budget for 2022 has assumed oil prices to $55 per barrel. Expenditures are estimated to reach QR204.3bn, 4.9% higher than 2021. QR17.8bn have been allocated to the education sector, or 8.7% of total expenditures, and QR20bn have been allocated to the health sector, representing 9.8% of total expenditures. The estimated budget deficit for the 2022 fiscal year is QR8.3bn. The Ministry of Finance noted the deficit will be addressed through current monetary balances and the issuance of local and foreign debt instruments if needed. Qatar's economy grew 2.6% year-on-year (y-o-y) in the third quarter (Q3) of 2021, driven mainly by the non-hydrocarbon sector according to official estimates. (Gulf-Times.com) DHBK reports net loss of QR188mn in 4Q2021 – Doha Bank (DHBK) reported net loss of QR188mn in 4Q2021 as compared to net loss of QR68.5mn in 4Q2020 and net profit of QR277.5mn in 3Q2021, (below our estimate of QR140.7mn). EPS amounted to QR0.16 in FY2021 as compared to QR0.16 in FY2020. Doha Bank Chairman Sheikh Fahad bin Mohammad bin Jabor Al Thani announced that the net profit of the bank for the year 2021 is QR704 million after taking additional extraordinary provisions during this year for more cautions. At the same meeting, the BOD decided to present a recommendation to the general assembly to distribute cash dividends of QR0.075 per share to shareholders. Sheikh Fahad stated that the bank’s net interest income significantly grew by 11.4 percent as compared to last year to reach QR2.6 billion. The net operating income stood at QR3.1 billion registering a growth of 5.8 percent compared to last year. Total assets amounted to QR 101.1 billion as at December 31, 2021. Net loans and advances reached QR62.7 billion and the investment portfolio amounted to QR25.1 billion. Customer deposits stood at QR50.4 billion as of December 31, 2021. He also declared that the total shareholder’s equity by end of 2021 reached QR14.3 billion, while the earnings per share was QR 0.16 and the return on average shareholders’ equity was 5.2 percent and the return on average assets was 0.69 percent. Sheikh Fahad added that the audited financial statements, declared net profit, distribution of cash dividends to shareholders that is equivalent to 7.5 percent of the paid-up capital are subject to the approval of the concerned regulatory authorities and the General Assembly of the shareholders. He said that the board of directors and the executive management will work together to achieve the objectives that are outlined in the bank’s strategy for the coming five years. During the meeting, the board approved the draft of the audited financial statements for the year 2021and the agenda of the Ordinary and Extra-Ordinary General Assembly Meeting of the shareholders. The board decided to call the Ordinary and Extra-Ordinary General Assembly of the Shareholders for a meeting on March 14, 2022, and in the event, the quorum is not met, a second meeting will be held on March 23, 2022. (QSE, QNBFS Research, Qatar Tribune) IQCD's bottom line rises 260.5% YoY and 16.7% QoQ in 4Q2021, below our estimate – Industries Qatar's (IQCD) net profit rose 260.5% YoY (+16.7% QoQ) to QR2450.7mn in 4Q2021, below our estimate of QR2,937.8mn (variation of -16.6%). The company's revenue came in at QR4,722.8mn in 4Q2021, which represents an increase of 126.3% YoY (+39.2% QoQ). EPS amounted to QR1.34 in FY2021 as compared to QR0.30 in FY2020. The board has recommended a cash dividend of QR1 per share, equating to 100% of the nominal share value. “2021 was an exceptional year where the group has strongly risen from last year’s challenges. During this year, we captured the benefits of a solid commodity price environment, underpinned by renewed product demand," said IQCD chairman HE Saad bin Sherida al-Kaabi. Driven by impressive operating cash flows, Ebitda (earnings before interest, taxes, depreciation and amortization) increased by 152% and reached QR10.2bn. Highlighting that blended product prices surged significantly by 58% y-o-y; IQCD said the growth in product prices translated into an increase of QR8.5bn in group’s net earnings. This price increase was linked to elevated market prices across all the segments, with fertilizer segment reporting a contribution of QR5.3bn, petrochemicals (QR2.3bn) and steel segment (QR0.9bn). The group's operating expenses increased by 25%, attributed to higher variable cost on account of increased sales volumes and raw material cost inflation. On the other hand, the group continues to benefit from the cost optimization initiatives implemented in the second half of 2020. IQCD's financial position continues to remain robust, with cash and bank balances at QR16bn in 2021, after accounting for a dividend payout of QR2bn for 2020. Currently, the group has no long-term debt obligations. Its reported total assets and total equity reached QR42.3bn and QR39.5bn, respectively, as on December 31, 2021. The petrochemicals segment’s net profit more than doubled y-o-y to QR2.5bn in 2021, primarily linked to improved product prices owing to better macroeconomic dynamics and supply bottlenecks. (QSE, QNBFS Research, Company Releases, Gulf-Times.com) QGTS posts 34.4% YoY increase but 4.7% QoQ decline in net profit in 4Q2021, in-line with our estimate – Qatar Gas Transport Company Limited's (QGTS) net profit rose 34.4% YoY (but declined 4.7% on QoQ basis) to QR350.5mn in 4Q2021, in- line with our estimate of QR344.4mn (variation of +1.8%). EPS amounted to QR0.24 in FY2021 as compared to QR0.21 in FY2020. QGTS reported a consolidated net profit of QR1,354mn in 2021, an increase of 16.7%, as compared to QR 1,160mn for the same period in 2020. For this period, the Board recommends a cash dividend at QR0.12 per share. During 2021, the COVID-19 global pandemic continued to create very challenging and volatile conditions across the global shipping as well as maritime industry. With solid business continuity and long- term strategies in place, QGTS remained steadfast in steering forward its vision and delivered excellence on both operational and financial fronts. QGTS’ resilient business model has allowed the company to generate sustainable returns for its long-term shareholders. (QSE, QNBFS Research, Company press release)
- 3. qnbfs.com Page 3 of 7 QNNS' bottom line declines 67.7% QoQ in 4Q2021, below our estimate – Qatar Navigation (QNNS) reported net profit of QR69.9mn in 4Q2021 as compared to net loss of QR324.6mn in 4Q2020 and net profit of QR216.5mn in 3Q2021, below our estimate of QR223.2mn. Reported earnings before impairments came in 8% below our estimates. The company's operating revenue came in at QR749.1mn in 4Q2021, which represents an increase of 37.3% YoY (+13.3% QoQ). Qatar Navigation which also goes by name ‘Milaha’ said it recorded a net profit of QR724mn for 2021 on operating revenue of QR2.78 billion. This is a huge jump from QR59 million recorded in net profit in 2020 on revenues of QR2.27 billion. Operating profit before impairments for 2021 stood at QR253 million, against QR279 million for the same period in 2020. This translates to earnings per share of QR0.64 for 2021 as against QR0.05 for 2020. Milaha Maritime and Logistics’ net profit increased by QR121 million, when compared with the same period in 2020. Strong container shipping rates coupled with network optimization measures improved profitability. Milaha Gas and Petrochem’s net profit increased by QR72 million compared with the same period in 2020 driven mainly by higher results from our joint venture and associate companies. Milaha Offshore’s bottom line increased by QR 438 million compared with the same period in 2020. The improvement was mainly attributable to a decrease in vessel impairments. Milaha Capital’s net profit increased by QR 34 million compared with the same period in 2020. The net increase is mainly due to a reduction in impairments. Milaha Trading’s bottom line decreased by QR 1 million compared with the same period in 2020. Despite increased heavy equipment and bunker sales, margin erosion brought overall performance down. Commenting on the company’s financial and operational performance for the year ended December 31st, 2021, Sheikh Jassim bin Hamad bin Jassim Jaber Al Thani, Milaha’s Chairman of the Board of Directors, said, “Milaha displayed strength and resilience in response to the global challenges and business disruptions faced in 2021. Our focus on our core business was demonstrated in our strong performance, on both financial and operational levels.” Milaha’s President and CEO Abdulrahman Essa Al Mannai said, “Despite the continued challenges and complex disruptions to the global supply chains, we were able to make significant strides, as we capitalized on the growing global demand for shipping services and strong market conditions. Our achievements are a strong testament to our dedication towards improving operational competitiveness, ensuring business continuity, and protecting our employees.” The Board of Directors decided to recommend to the General Assembly to distribute a 30 percent cash dividend of the par value of a share, equivalent to QR0.30 per share, representing a payout ratio of 47 percent of 2021 net profit (QSE, QNBFS Research, Company releases, Qatar Tribune) QAMC's bottom line rises 279.8% YoY and 34.4% QoQ in 4Q2021 – Qatar Aluminium Manufacturing Company's (QAMC) net profit rose 279.8% YoY (+34.4% QoQ) to QR313.1mn in 4Q2021.The company's share of net results of investment in a joint venture came in at QR311.6mn in 4Q2021, which represents an increase of 274.6% YoY (+34.1% QoQ). EPS amounted to QR0.150 in FY2021 as compared to QR0.017 in FY2020. The board has recommended a total annual dividend distribution of QR446mn for the proposed year, representing a payout ratio of 53% of current year’s net earnings. A dividend of QR0.08 per share representing 8% of par value resulting in a dividend yield of 4.4% on the closing share price as on December 31, 2021. (QSE, Gulf-Times.com)
- 4. qnbfs.com Page 4 of 7 Qatar Stock Exchange Top Gainers Top Decliners Source: Qatar Stock Exchange (QSE) Source: Qatar Stock Exchange (QSE) Most Active Shares by Value (QR Million) Most Active Shares by Volume (Million) Source: Qatar Stock Exchange (QSE) Source: Qatar Stock Exchange (QSE) Investor Trading Percentage to Total Value Traded Net Traded Value by Nationality (QR Million) Source: Qatar Stock Exchange (QSE) Source: Qatar Stock Exchange (QSE) 20.3% 11.9% 9.1% 7.6% 6.6% 0.0% 8.0% 16.0% 24.0% Islamic Holding Group Salam International Investment Limited Industries Qatar Mesaieed Petrochemical Holding Company Qatar Oman Investment Company -7.2% -7.1% -6.9% -5.6% -3.7% -9.0% -6.0% -3.0% 0.0% Qatar Industrial Manufacturing Company Mannai Corporation Doha Bank Qatar General Insurance & Reinsurance Company United Development Company 670.7 305.6 274.1 205.3 196.5 0.0 250.0 500.0 750.0 Industries Qatar Qatar Islamic Bank Qatar Aluminium Manufacturing Company Salam International Investment Limited QNB Group 223.1 131.8 62.8 37.7 37.3 0.0 80.0 160.0 240.0 Salam International Investment Limited Qatar Aluminium Manufacturing Company Mesaieed Petrochemical Holding Company Mazaya Qatar Real Estate Development Industries Qatar 0% 20% 40% 60% 80% 100% Buy Sell 41.77% 50.87% 19.63% 22.69% 12.24% 12.76% 26.35% 13.68% Qatari Individuals Qatari Institutions Non-Qatari Individuals Non-Qatari Institutions 1,902 1,195 2,278 819 -377 376 -1,000 -500 0 500 1,000 1,500 2,000 2,500 Qatari Non-Qatari Net Investment Total Sold Total Bought
- 5. qnbfs.com Page 5 of 7 TECHNICAL ANALYSIS OF THE QSE INDEX Source: Bloomberg The QE Index stayed with momentum and closed higher by another 1.2% from the previous week. The Index printed last 12,808.93. Thesis has not changed for the Index as the trend remains up and corrections can be used for better entries into the market. The index reached our expected soft resistance at the 12,800 points, but we see it possibly moving to our expected hard resistance level at 13,000 points; we move our support level to 12,000 points. DEFINITIONS OF KEY TERMS USED IN TECHNICAL ANALYSIS RSI (Relative Strength Index) indicator – RSI is a momentum oscillator that measures the speed and change of price movements. The RSI oscillates between 0 to 100. The index is deemed to be overbought once the RSI approaches the 70 level, indicating that a correction is likely. On the other hand, if the RSI approaches 30, it is an indication that the index may be getting oversold and therefore likely to bounce back. MACD (Moving Average Convergence Divergence) indicator – The indicator consists of the MACD line and a signal line. The divergence or the convergence of the MACD line with the signal line indicates the strength in the momentum during the uptrend or downtrend, as the case may be. When the MACD crosses the signal line from below and trades above it, it gives a positive indication. The reverse is the situation for a bearish trend. Candlestick chart – A candlestick chart is a price chart that displays the high, low, open, and close for a security. The ‘body’ of the chart is portion between the open and close price, while the high and low intraday movements form the ‘shadow’. The candlestick may represent any time frame. We use a one-day candlestick chart (every candlestick represents one trading day) in our analysis. Doji candlestick pattern – A Doji candlestick is formed when a security's open and close are practically equal. The pattern indicates indecisiveness, and based on preceding price actions and future confirmation, may indicate a bullish or bearish trend reversal. Shooting Star/Inverted Hammer candlestick patterns – These candlestick patterns have a small real body (open price and close price are near to each other), and a long upper shadow (large intraday movement on the upside). The Shooting Star is a bearish reversal pattern that forms after a rally. The Inverted Hammer looks exactly like a Shooting Star, but forms after a downtrend. Inverted Hammers represent a potential bullish trend reversal.
- 6. qnbfs.com Page 6 of 7 Source: Bloomberg Company Name Price February 10 % Change WTD % Change YTD Market Cap. QR Million TTM P/E P/B Div. Yield Qatar National Bank 21.55 (1.15) 6.74 199,045 16.3 2.5 2.1 Qatar Islamic Bank 20.18 0.10 10.09 47,684 14.2 2.3 2.0 Commercial Bank of Qatar 6.93 (2.72) 2.68 28,047 13.7 1.5 1.4 Doha Bank 2.74 (6.90) (14.47) 8,486 11.9 0.8 2.7 Al Ahli Bank 4.50 0.00 17.49 10,933 15.3 1.7 3.3 Qatar International Islamic Bank 10.29 0.10 11.73 15,576 17.3 2.4 3.2 Masraf Al Rayan 5.03 0.28 8.41 46,779 22.5 1.9 3.4 Qatar First Bank 1.81 1.12 1.06 1,266 10.7 2.3 N/A National Leasing 0.91 2.70 (2.77) 452 N/A 0.7 2.7 Dlala Holding 1.42 4.03 15.07 404 26.1 1.8 N/A Qatar & Oman Investment 0.87 6.62 6.88 274 48.5 0.9 N/A Islamic Holding Group 4.85 20.35 22.94 275 45.0 1.9 1.0 Banking and Financial Services 359,222 Zad Holding 16.93 (1.57) 1.38 4,414 22.8 3.0 3.8 Qatar German Co. for Medical Devices 2.70 1.47 (15.09) 312 102.3 9.4 N/A Salam International Investment 0.95 11.88 16.12 1,087 N/A 0.7 N/A Baladna 1.50 (0.47) 3.67 2,848 N/A 1.3 3.5 Medicare Group 8.49 (1.71) (0.13) 2,389 26.5 2.4 21.2 Qatar Cinema & Film Distribution 3.74 1.77 5.44 235 76.5 1.7 2.7 Qatar Fuel 19.75 1.28 8.04 19,637 20.3 2.2 2.3 Qatar Meat and Livestock 3.50 (2.29) (2.75) 629 N/A 2.0 2.9 Mannai Corp. 8.08 (7.07) 70.18 3,686 9.2 1.7 0.1 Al Meera Consumer Goods 20.30 2.78 3.57 4,060 22.5 2.7 4.4 Consumer Goods and Services 39,296 Qatar Industrial Manufacturing 3.19 (7.18) 3.94 1,516 11.0 0.9 3.1 Qatar National Cement 6.40 (1.54) 25.49 4,183 18.5 1.4 3.1 Industries Qatar 18.30 9.12 18.14 110,715 13.7 2.8 1.8 Qatari Investors Group 2.29 0.44 3.15 2,847 20.7 1.0 2.6 Qatar Electricityand Water 18.00 (0.28) 8.43 19,800 15.1 1.7 3.5 Aamal 1.09 (0.91) 0.55 6,867 28.6 0.9 3.7 Gulf International Services 1.73 (1.82) 0.76 3,213 N/A 1.0 N/A Mesaieed Petrochemical Holding 2.73 7.57 30.48 34,260 20.9 2.1 1.5 Invesment Holding Group 1.31 3.23 6.59 1,087 54.7 1.3 N/A Qatar Aluminum Manufacturing 2.10 3.81 16.60 11,718 14.1 1.8 1.7 Industrials 196,207 Qatar Insurance 2.62 0.11 (4.76) 8,554 16.1 1.0 N/A QLM Life & Medical Insurance 5.20 0.93 2.93 1,819 N/A 3.1 N/A Doha Insurance 1.92 2.30 (0.21) 958 13.6 0.8 5.2 Qatar General Insurance & Reinsurance 2.02 (5.61) 1.00 1,768 13.7 0.3 N/A Al Khaleej Takaful Insurance 3.83 (1.03) 6.47 978 20.1 1.9 1.3 Qatar Islamic Insurance 8.55 3.01 6.88 1,283 15.8 3.2 3.8 Insurance 15,360 United Development 1.68 (3.68) 8.83 5,934 16.7 0.5 3.0 Barwa Real Estate 3.47 (0.26) 13.40 13,503 11.0 0.7 3.6 Ezdan Real Estate 1.42 (2.74) 5.89 37,665 97.9 1.2 N/A Mazaya Qatar Real Estate Development 0.91 0.78 (1.20) 1,052 34.3 0.8 3.3 Real Estate 58,155 Ooredoo 7.39 1.22 5.26 23,668 N/A 1.2 3.4 Vodafone Qatar 1.78 0.51 7.02 7,541 22.9 1.6 2.8 Telecoms 31,209 Qatar Navigation (Milaha) 8.40 (3.47) 9.98 9,544 13.2 0.7 3.6 Gulf Warehousing 4.63 (2.16) 1.98 271 12.1 1.3 2.2 Qatar Gas Transport (Nakilat) 3.51 (3.54) 6.39 19,452 14.2 2.2 3.1 Transportation 29,267 Qatar Exchange 731,156
- 7. qnbfs.com Contacts QNB Financial Services Co. W.L.L. Contact Center: (+974) 4476 6666 info@qnbfs.com.qa Doha, Qatar Saugata Sarkar, CFA, CAIA Head of Research saugata.sarkar@qnbfs.com.qa Shahan Keushgerian Senior Research Analyst shahan.keushgerian@qnbfs.com.qa . Disclaimer and Copyright Notice: This publication has been prepared by QNB Financial Services Co. W.L.L. (“QNBFS”) a wholly-owned subsidiary of Qatar National Bank (Q.P.S.C.). QNB FS is regulated by the Qatar Financial Markets Authority and the Qatar Exchange. Qatar National Bank (Q.P.S.C.) is regulated by the Qatar Central Bank. This publication expresses the views and opinions of QNBFS at a given time only. It is not an offer, promotion or recommendation to buy or sell securities or other investments, nor is it intended to constitute legal, tax, accounting, or financial advice. QNBFS accepts no liability whatsoever for any direct or indirect losses arising from use of this report. Any investment decision should depend on the individual circumstances of the investor and be based on specifically engaged investment advice. We therefore strongly advise potential investors to seek independent professional advice before making any investment decision. Although the information in this report has been obtained from sources that QNBFS believes to be reliable, we have not independently verified such information and it may not be accurate or complete. QNBFS does not make any representations or warranties as to the accuracy and completeness of the information it may contain, and declines any liability in that respect. For reports dealing with Technical Analysis, expressed opinions and/or recommendations may be different or contrary to the opinions/recommendations of QNBFS Fundamental Research as a result of depending solely on the historical technical data (price and volume). QNBFS reserves the right to amend the views and opinions expressed in this publication at any time. It may also express viewpoints or make investment decisions that differ significantly from, or even contradict, the views and opinions included in this report. This report may not be reproduced in whole or in part without permission from QNBFS. COPYRIGHT: No part of this document may be reproduced without the explicit written permission of QNBFS. Page 7 of 7