Weekly market report
•
0 likes•537 views

- The Qatari stock market gained slightly over the week, with the QSE Index rising 0.68% and market capitalization increasing 0.76%. Trading volume and value both decreased compared to the previous week. - Foreign investors remained bullish overall for the week, while Qatari investors turned bearish. The real estate and banking sectors contributed most to trading volume and value. - Key news included Qatar expected to have a budget surplus for 2014-15 despite falling oil prices, several agreements signed between Qatar and China to strengthen economic ties, and new Qatari regulations on margin trading and junior market listings.

More Related Content
What's hot
What's hot (20)
Similar to Weekly market report
Similar to Weekly market report (20)
More from QNB Group
More from QNB Group (20)
Recently uploaded
Recently uploaded (20)
Weekly market report
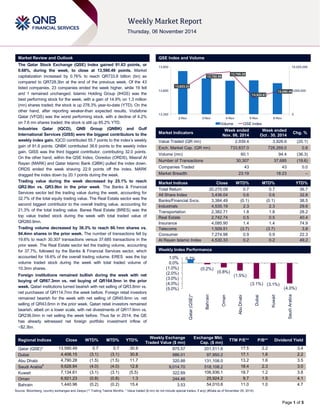
- 1. Page 1 of 5 Market Review and Outlook QSE Index and Volume The Qatar Stock Exchange (QSE) Index gained 91.63 points, or 0.68%, during the week, to close at 13,590.49 points. Market capitalization increased by 0.76% to reach QR733.8 billion (bn) as compared to QR728.3bn at the end of the previous week. Of the 43 listed companies, 23 companies ended the week higher, while 19 fell and 1 remained unchanged. Islamic Holding Group (IHGS) was the best performing stock for the week, with a gain of 14.9% on 1.3 million (mn) shares traded; the stock is up 278.3% year-to-date (YTD). On the other hand, after reporting weaker-than expected results, Vodafone Qatar (VFQS) was the worst performing stock, with a decline of 4.2% on 7.6 mn shares traded; the stock is still up 85.2% YTD. Industries Qatar (IQCD), QNB Group (QNBK) and Gulf International Services (GISS) were the biggest contributors to the weekly index gain. IQCD contributed 55.7 points to the index’s weekly gain of 91.6 points. QNBK contributed 38.6 points to the weekly index gain. GISS was the third biggest contributor, contributing 32.0 points. On the other hand, within the QSE Index, Ooredoo (ORDS), Masraf Al Rayan (MARK) and Qatar Islamic Bank (QIBK) pulled the index down. ORDS ended the week shaving 22.9 points off the index. MARK dragged the index down by 20.1 points during the week. Trading value during the week decreased by 25.1% to reach QR2.9bn vs. QR3.9bn in the prior week. The Banks & Financial Services sector led the trading value during the week, accounting for 32.7% of the total equity trading value. The Real Estate sector was the second biggest contributor to the overall trading value, accounting for 21.3% of the total trading value. Barwa Real Estate (BRES) was the top value traded stock during the week with total traded value of QR260.9mn. Trading volume decreased by 36.3% to reach 60.1mn shares vs. 94.4mn shares in the prior week. The number of transactions fell by 19.6% to reach 30,307 transactions versus 37,685 transactions in the prior week. The Real Estate sector led the trading volume, accounting for 37.7%, followed by the Banks & Financial Services sector, which accounted for 18.6% of the overall trading volume. ERES was the top volume traded stock during the week with total traded volume of 10.3mn shares. Foreign institutions remained bullish during the week with net buying of QR67.3mn vs. net buying of QR164.5mn in the prior week. Qatari institutions turned bearish with net selling of QR3.8mn vs. net purchases of QR114.7mn the week before. Foreign retail investors remained bearish for the week with net selling of QR45.6mn vs. net selling of QR43.6mn in the prior week. Qatari retail investors remained bearish, albeit on a lower scale, with net divestments of QR17.6mn vs. QR236.0mn in net selling the week before. Thus far in 2014, the QE has already witnessed net foreign portfolio investment inflow of ~$2.3bn. Market Indicators Week ended Nov. 06, 2014 Week ended Oct . 30, 2014 Chg. % Value Traded (QR mn) 2,939.4 3,926.6 (25.1) Exch. Market Cap. (QR mn) 733,837.0 728,269.0 0.8 Volume (mn) 60.1 94.4 (36.3) Number of Transactions 30,307 37,685 (19.6) Companies Traded 43 43 0.0 Market Breadth 23:19 18:23 – Market Indices Close WTD% MTD% YTD% Total Return 20,270.09 0.7 0.7 36.7 All Share Index 3,436.04 0.6 0.6 32.8 Banks/Financial Svcs. 3,384.49 (0.1) (0.1) 38.5 Industrials 4,535.19 2.3 2.3 29.6 Transportation 2,382.71 1.8 1.8 28.2 Real Estate 2,742.74 0.5 0.5 40.4 Insurance 4,085.90 1.4 1.4 74.9 Telecoms 1,509.51 (3.7) (3.7) 3.8 Consumer 7,274.98 0.9 0.9 22.3 Al Rayan Islamic Index 4,530.33 0.2 0.2 49.2 Market Indices Weekly Index Performance Regional Indices Close WTD% MTD% YTD% Weekly Exchange Traded Value ($ mn) Exchange Mkt. Cap. ($ mn) TTM P/E** P/B** Dividend Yield Qatar (QSE)* 13,590.49 0.7 0.7 30.9 875.57 201,511.6 17.5 2.2 3.4 Dubai 4,406.15 (3.1) (3.1) 30.8 986.01 97,950.2 17.1 1.6 2.2 Abu Dhabi 4,790.28 (1.5) (1.5) 11.7 320.88 131,108.0 13.2 1.6 3.5 Saudi Arabia# 9,628.84 (4.0) (4.0) 12.8 9,014.70 518,108.2 18.4 2.3 3.0 Kuwait 7,134.61 (3.1) (3.1) (5.5) 322.69 106,936.1 18.7 1.2 3.8 Oman 6,921.23 (0.8) (0.8) 1.3 244.46 25,924.2 9.7 1.5 4.1 Bahrain 1,440.96 (0.2) (0.2) 15.4 3.53 54,010.6 11.0 1.0 4.7 Source: Bloomberg, country exchanges and Zawya (** Trailing Twelve Months; * Value traded ($ mn) do not include special trades, if any) (#Data as of November 05, 2014) 13,623.33 13,780.59 13,799.29 13,528.67 13,590.49 0 8,000,000 16,000,000 13,350 13,600 13,850 2-Nov 3-Nov 4-Nov 5-Nov 6-Nov Volume QSE Index 0.7% (0.2%) (0.8%) (1.5%) (3.1%) (3.1%) (5.0%) (4.0%) (4.0%) (3.0%) (2.0%) (1.0%) 0.0% 1.0% Qatar (QSE)* Bahrain Oman Abu Dhabi Dubai Kuwait Saudi Arabia
- 2. Page 2 of 5 News Economic News Qatar is set for budget surplus in 2014-15 despite oil price dip – Qatar may end the financial year on a budget surplus despite the slump in global oil prices by about 25% since June due to a glut in the market, weaker demand and a gloomy global growth outlook. Qatar has already earned an average $104.8 per barrel in 1H2014-15 up to September, against the conservative crude oil price assumption of $65/bbl in the 2014- 15 budget. The Qatari crude fetched $105.59/bbl on an average from January to September. Qatar’s crude has been classified as Dukhan and Marine and the average of the two makes up the price. Even at the conservative oil price assumption of $65 a barrel, Qatar had projected a budget surplus of QR7.3bn for the current financial year. According to official sources, the Qatari crude price declined YoY only twice between 2005 and 2013, and that was in 2009 (-34.7%) and 2013 (-2.8%). (Gulf- Base.com) QCB issues T-bills worth QR4bn – The Qatar Central Bank (QCB) has issued three-month treasury bills worth QR2bn, along with six-month and nine-month T-bills worth QR1bn each on November 4, 2014. The yield for three-month T-bills is 0.76%, while for six and nine-month T-bills, it is 0.90% and 0.97%, respectively. (QCB) Qatar, China sign key agreements; trade volume hits $11.5bn in 2013 – Qatar and China signed a slew of agreements for further strengthening bilateral relations. A memorandum of understanding (MoU) was signed on promoting cooperation in the construction of the Silk Road Economic Belt and the Maritime Silk Road. The first executive program in the education field for the Educational & Cultural Cooperation Agreement between governments of Qatar and China was also signed. Another MoU was signed between the Qatar Central Bank and the People’s Bank of China for cooperation in financial services activities between Qatar and China. Meanwhile, the volume of trade between Qatar and China during 2008-2013 rose by 345% to reach $11.5bn in 2013. (Gulf-Times.com) China appoints ICBC Doha as yuan clearing bank – The Industrial & Commercial Bank of China’s (ICBC) Doha Branch has been designated as the Chinese yuan clearing bank in Doha. After being mandated as the yuan clearing bank, ICBC’s Doha Branch stated that it will strictly adhere to the regulations under the direction of authorities of both China and Qatar, and commit to providing an efficient RMB clearing service. (Gulf- Times.com) Market & Corporate News QFMA issues new rules on margin trading, Venture Market listing, functioning of BoD – Qatar will allow margin trading in its booming capital markets as the emerging market marches toward modernizing its financial infrastructure. The Qatar Financial Market Authority (QFMA) has issued several new regulatory legislations, including that on margin trading and the issue offering and listing of securities on the junior bourse – Venture Market for small & medium enterprises (SMEs). A QFMA spokesman said that margin trading means those transactions where a financial services company funds a percentage of the securities’ market value purchased for its client, pursuant to the agreement governing the relation between them. Further, QFMA issued new rules to regulate the functioning of Board of Directors (BoD) of QE-listed companies. The rules aim to enhance transparency in the functioning of BoD, eliminate conflict of interest and misuse of insider information. (Gulf-Times.com) VFQS posts a loss of QR53.5mn in the July to September quarter of 2014 – Vodafone Qatar (VFQS) reported a net loss of QR53.5mn in July to September quarter of 2014 vs. a loss of QR27.4mn in April to June quarter of 2014. For the first six month of current financial year (ending September 30, 2014), VFQS’ customer base grew 16% YoY to 1.372mn while ARPU rose 3% YoY to QR128. As a result VFQS’ EBITDA increased to QR295mn. However, the loss per share stood at QR0.10 as compared to QR0.19 in the same period last year. (Press Release) VFQS’ capex to reach QR500mn by 2014-end; plans to buy Qnbn – Vodafone Qatar’s (VFQS) capital expenditure (capex) will reach nearly QR500mn by 2014-end. VFQS’ CEO, Kyle Whitehill said that in 2H2014, the focus would be on increasing the network footprint, long term evolution and improving the overall customer experience. He added that the proposed deal to buy the Qatar National Broadband Network (Qnbn) is in early stages. Earlier, VFQS said it does not own any shares in Qnbn currently, but after the completion of the deal, it would own 100%. The combination of VFQS and Qnbn will enable the company to deliver various benefits to customers in the fixed- line market in Qatar. (GulfBase.com) AHCS posts QR119.3mn net profit in 3Q2014 – Aamal Company (AHCS) reported a net profit of QR119.3mn in 3Q2014, indicating an increase of 56.4% QoQ and 11.8% YoY. AHCS’ reported EPS amounted to QR0.21 in 3Q2014 versus QR0.18 in 3Q2013. Revenue for 3Q2014 increased by 10.6% QoQ to reach QR505.1mn (down by 10.8% YoY). (QE) DBIS’ net profit declines 65.2% QoQ in 3Q2014 – Dlala Brokerage & Investments Holding Company (DBIS) net profit decreased 65.2% QoQ (up by 7.9% YoY) to QR11.7mn in 3Q2014, primarily due to lower net brokerage & commission income and net investment income. The Company’s net brokerage & commission income plunged 39.2% QoQ to QR15.0mn (+109.9% YoY) while its net investment income declined 87.4% QoQ (down by 70.4% YoY) to QR1.9mn in 3Q2014. Consequently, DBIS’ net operating income recorded a sharp fall of 54.9% QoQ (-0.1% YoY) to QR18.4mn in 3Q2014. EPS stood at QR0.53 in 3Q2014 as compared to QR1.52 in 2Q2014. (QE) DHBK invites shareholders to attend EGM on November 30 – Doha Bank’s (DHBK) board of directors has invited its shareholders to attend the Extraordinary General Assembly Meeting (EGM) scheduled on November 30, 2014. The EGM’s agenda is to approve the scheme of amalgamation of the India operations of HSBC Bank Oman with the transfer of the undertaking as a going concern as per Indian Banking Regulations and to combine it with DHBK’s India branch. The agenda also includes amending the Article (21) of the Articles of Association where the company shall be managed by a board of directors of seven members, elected by the ordinary general assembly through secret ballot. However, in case the required quorum is not attained on November 30, a second EGM will be held on December 7, 2014. (QSE) KCBK extends financing to Al Rayyan Road project – Al Khalij Commercial Bank (KCBK) has extended financing facilities for a contract awarded to a JV between Boom Construction Company and Six Construct Qatar for the Al Rayyan Road construction project. (Bloomberg)
- 3. Page 3 of 5 Qatar Stock Exchange Top 5 Gainers Top 5 Decliners Source: Qatar Stock Exchange (QSE) Source: Qatar Stock Exchange (QSE) Most Active Shares by Value (QR Million) Most Active Shares by Volume (Million) Source: Qatar Stock Exchange (QSE) Source: Qatar Stock Exchange (QSE) Investor Trading Percentage to Total Value Traded Net Traded Value by Nationality (QR Million) Source: Qatar Stock Exchange (QSE) Source: Qatar Stock Exchange (QSE) 14.9% 5.2% 4.8% 4.8% 3.9% 0.0% 5.0% 10.0% 15.0% Islamic Holding Group Al Khaleej Takaful Insurance Gulf International Services Barwa Real Estate Widam Food Co. -4.2% -3.6% -3.6% -3.3% -3.0% -6.0% -4.0% -2.0% 0.0% Vodafone Qatar United Development Ooredoo Gulf Warehousing Zad Holding 260.9 247.6 216.7 212.4 203.0 0.0 100.0 200.0 300.0 Barwa Real Estate QNB Group Industries Qatar Islamic Holding Group Ezdan Real Estate 10.3 7.6 5.9 3.9 3.6 0.0 4.0 8.0 12.0 Ezdan Real Estate Vodafone Qatar Barwa Real Estate Mazaya Qatar Masraf Al Rayan 0% 20% 40% 60% 80% 100% Buy Sell 44.30% 44.90% 18.69% 18.82% 14.11% 15.66% 22.90% 20.61% Qatari Individuals Qatari Institutions Non-Qatari Individuals Non-Qatari Institutions 1,852 1,088 1,873 1,066 (21) 22 (500) - 500 1,000 1,500 2,000 Qatari Non-Qatari Net Investment Total Sold Total Bought
- 4. Page 4 of 5 TECHNICAL ANALYSIS OF THE QSE INDEX Source: Bloomberg The QSE Index extended its winning streak for the third straight week and gained around 92 points. It was a good week for the bulls, as the index moved higher on every trading session except on Wednesday, when it witnessed severe profit-booking, trimming the majority of its gains. Meanwhile, the index recaptured the 21-day moving average and the 13,584.0 level, making further headway. However, volumes were comparatively less compared to the prior week, which casts a doubt on this bullish momentum. The index will come under a firm bull-grip only if it manages to surpass and sustain above the 13,700.0 level along with the 55-day moving average on a weekly closing basis. Otherwise, the index will slip back toward the 21-day moving average or possibly even lower. For now, both the momentum indicators are stalling, which indicates a lack of clarity in the direction of the index. DEFINITIONS OF KEY TERMS USED IN TECHNICAL ANALYSIS RSI (Relative Strength Index) indicator – RSI is a momentum oscillator that measures the speed and change of price movements. The RSI oscillates between 0 to 100. The index is deemed to be overbought once the RSI approaches the 70 level, indicating that a correction is likely. On the other hand, if the RSI approaches 30, it is an indication that the index may be getting oversold and therefore likely to bounce back. MACD (Moving Average Convergence Divergence) indicator – The indicator consists of the MACD line and a signal line. The divergence or the convergence of the MACD line with the signal line indicates the strength in the momentum during the uptrend or downtrend, as the case may be. When the MACD crosses the signal line from below and trades above it, it gives a positive indication. The reverse is the situation for a bearish trend. Candlestick chart – A candlestick chart is a price chart that displays the high, low, open, and close for a security. The ‘body’ of the chart is portion between the open and close price, while the high and low intraday movements form the ‘shadow’. The candlestick may represent any time frame. We use a one-day candlestick chart (every candlestick represents one trading day) in our analysis. Doji candlestick pattern – A Doji candlestick is formed when a security's open and close are practically equal. The pattern indicates indecisiveness, and based on preceding price actions and future confirmation, may indicate a bullish or bearish trend reversal. Shooting Star/Inverted Hammer candlestick patterns – These candlestick patterns have a small real body (open price and close price are near to each other), and a long upper shadow (large intraday movement on the upside). The Shooting Star is a bearish reversal pattern that forms after a rally. The Inverted Hammer looks exactly like a Shooting Star, but forms after a downtrend. Inverted Hammers represent a potential bullish trend reversal.
- 5. Contacts Saugata Sarkar Abdullah Amin, CFA Shahan Keushgerian Head of Research Senior Research Analyst Senior Research Analyst Tel: (+974) 4476 6534 Tel: (+974) 4476 6569 Tel: (+974) 4476 6509 saugata.sarkar@qnbfs.com.qa abdullah.amin@qnbfs.com.qa shahan.keushgerian@qnbfs.com.qa Sahbi Kasraoui Ahmed Al-Khoudary QNB Financial Services SPC Manager – HNWI Head of Sales Trading – Institutional Contact Center: (+974) 4476 6666 Tel: (+974) 4476 6544 Tel: (+974) 4476 6548 PO Box 24025 sahbi.alkasraoui@qnbfs.com.qa ahmed.alkhoudary@qnbfs.com.qa Doha, Qatar DISCLAIMER: This publication has been prepared by QNB Financial Services SPC (“QNBFS”) a wholly-owned subsidiary of Qatar National Bank (“QNB”). QNBFS is regulated by the Qatar Financial Markets Authority and the Qatar Stock Exchange; QNB is regulated by the Qatar Central Bank. This publication expresses the views and opinions of QNBFS at a given time only. It is not an offer, promotion or recommendation to buy or sell securities or other investments, nor is it intended to constitute legal, tax, accounting, or financial advice. We therefore strongly advise potential investors to seek independent professional advice before making any investment decision. Although the information in this report has been obtained from sources that QNBFS believes to be reliable, we have not independently verified such information and it may not be accurate or complete. While this publication has been prepared with the utmost degree of care by our analysts, QNBFS does not make any representations warranties as to the accuracy and completeness of the information it may contain, and declines any liability in that respect. QNBFS reserves the right to amend the views and opinions expressed in this publication at any time. It may also express viewpoints or make investment decisions that differ significantly from, or even contradict, the views and opinions included in this report. COPYRIGHT: No part of this document may be reproduced without the explicit written permission of QNBFS. Page 5 of 5 Source: Bloomberg Company NamePrice(November 06) % Change 5-Day% Change YTDMarket Cap. QR MillionTTM P/EP/BDiv. YieldQatar National Bank218.101.7726.80152,611 14.72.83.2Qatar Islamic Bank109.20(2.50)58.2625,803 17.52.13.7Commercial Bank of Qatar73.40(0.68)24.4121,795 12.01.32.3Doha Bank58.701.210.8615,166 10.61.37.7Al Ahli Bank54.00(2.70)27.648,921 15.62.2N/AQatar International Islamic Bank85.40(1.84)38.4112,927 16.02.44.4Masraf Al Rayan50.20(1.57)60.3837,650 20.03.53.0Al Khaliji Bank21.70(0.46)8.557,812 13.91.44.6National Leasing26.100.97(13.43)1,291 32.21.05.7Dlala Holding57.80(0.69)161.541,283 16.34.7N/AQatar & Oman Investment17.150.8836.98540 21.51.43.5Islamic Holding Group174.0014.93278.26696 49.210.81.0Banking and Financial Services286,496 Zad Holding85.00(2.97)22.301,112 10.31.44.1Qatar German Co. for Medical Devices12.100.00(12.64)140 N/A0.8N/ASalam International Investment18.102.2639.122,069 28.21.35.5Medicare Group125.00(1.11)138.103,518 23.64.21.4Qatar Cinema & Film Distribution42.00(2.78)4.74240 20.21.7N/AQatar Fuel217.000.84(0.70)18,328 16.02.83.5Qatar Meat and Livestock63.403.9322.631,141 21.34.53.3Al Meera Consumer Goods191.803.2343.893,836 14.23.04.2Consumer Goods and Services30,383 Qatar Industrial Manufacturing46.401.3110.042,205 11.31.4N/AQatar National Cement132.200.1511.096,491 14.62.54.5Industries Qatar194.002.9714.86117,370 18.43.75.7Qatari Investors Group48.85(1.01)11.786,073 28.52.71.5Qatar Electricity and Water186.202.2012.6020,482 13.33.13.7Mannai Corp.111.60(0.27)24.145,091 9.62.54.9Aamal14.73(0.67)(1.80)8,838 16.21.3N/AGulf International Services124.704.79155.5323,174 23.26.41.3Mesaieed Petrochemical Holding32.101.10N/A40,328 N/A3.01.1Industrials230,053 Qatar Insurance98.000.9384.2115,733 15.62.82.0Doha Insurance34.001.4936.001,700 12.01.65.9Qatar General Insurance & Reinsurance46.302.8915.993,203 2.10.52.7Al Khaleej Takaful Insurance48.405.2272.381,074 12.21.5N/AQatar Islamic Insurance88.100.1152.161,322 16.14.44.3Insurance23,032 United Development25.70(3.56)19.359,100 24.20.83.7Barwa Real Estate45.004.7751.0117,511 12.81.34.4Ezdan Real Estate19.69(0.05)15.8252,228 38.81.71.6Mazaya Qatar Real Estate Development23.75(1.45)112.432,375 11.11.93.2Real Estate81,213 Qatar Telecom119.10(3.56)(13.19)38,150 15.01.53.4Vodafone Qatar19.83(4.20)85.1516,764 N/A3.00.9Telecoms54,914 Qatar Navigation (Milaha)100.002.2520.4811,453 11.40.95.0Gulf Warehousing56.10(3.28)35.182,668 20.73.22.7Qatar Gas Transport (Nakilat)24.332.4420.1513,625 15.53.74.5Transportation27,745 Qatar Stock Exchange733,837