Weekly market report
•
1 like•300 views

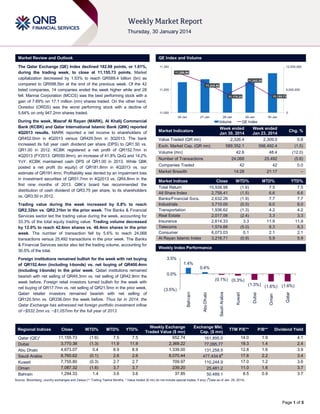
- The Qatar Exchange index declined 1.61% during the week to close at 11,155.73 points. Trading value increased 0.8% while volume decreased 12% and number of transactions fell 5.6%. - Masraf Al Rayan reported a 5.2% quarter-on-quarter increase in net income to QR452mn and increased its dividend to QR1.50 per share. Qatar International Islamic Bank's net profit reached QR750mn for 2013. - Al Khalij Commercial Bank's net profit rose 41.8% quarter-on-quarter to QR152.7mn in Q4 2013 and it declared a 10% cash dividend. Vodafone Qatar's revenue was in

Recommended
More Related Content
What's hot
What's hot (20)
Viewers also liked
Viewers also liked (20)
Similar to Weekly market report
Similar to Weekly market report (20)
More from QNB Group
More from QNB Group (20)
Recently uploaded
Recently uploaded (20)
Weekly market report
- 1. QE Index and Volume 11,350 12,000,000 11,298.96 11,243.35 11,245.86 11,200 6,000,000 11,050 0 26-Jan Regional Indices Qatar (QE)* Dubai Abu Dhabi Saudi Arabia Kuwait Oman Bahrain Close 11,155.73 3,770.38 4,673.07 8,760.62 7,755.80 7,087.32 1,294.33 WTD% MTD% YTD% (1.6) (1.3) 0.4 (0.1) (0.3) (1.6) 1.4 7.5 11.9 8.9 2.6 2.7 3.7 3.6 7.5 11.9 8.9 2.6 2.7 3.7 3.6 29-Jan 30-Jan QE Index Value Traded (QR mn) Week ended Jan 23, 2014 2,309.0 589,352.1 598,492.4 (1.5) Exch. Market Cap. (QR mn) Volume (mn) Chg. % 0.8 42.6 Market Indices Close Total Return 15,938.98 All Share Index 2,758.41 Banks/Financial Svcs. 2,632.26 Industrials 3,710.00 Transportation 1,936.62 Real Estate 2,017.06 Insurance 2,614.33 Telecoms 1,574.66 Consumer 6,073.03 Al Rayan Islamic Index 3,216.71 Market Indices Weekly Index Performance (5.6) 42 0.0 14:28 Market Breadth (12.0) 25,492 42 Companies Traded 48.4 24,068 Number of Transactions 21:17 – WTD% (1.6) (1.5) (1.9) (0.5) (1.3) (2.4) 3.3 (5.0) 0.1 (0.9) MTD% 7.5 6.6 7.7 6.0 4.2 3.3 11.9 8.3 2.1 5.9 YTD% 7.5 6.6 7.7 6.0 4.2 3.3 11.9 8.3 2.1 5.9 3.5% 1.4% 0.4% 0.0% (0.1%) (0.3%) Weekly Exchange Traded Value ($ mn) 652.74 2,369.22 1,339.00 8,070.44 709.97 239.20 37.85 Qatar (1.3%) (1.6%) (1.6%) Oman (3.5%) Dubai Foreign institutions remained bullish for the week with net buying of QR152.4mn (including t-bonds) vs. net buying of QR400.4mn (including t-bonds) in the prior week. Qatari institutions remained bearish with net selling of QR49.3mn vs. net selling of QR42.9mn the week before. Foreign retail investors turned bullish for the week with net buying of QR17.7mn vs. net selling of QR21.5mn in the prior week. Qatari retailer investors remained bearish with net selling of QR120.5mn vs. QR336.0mn the week before. Thus far in 2014, the Qatar Exchange has witnessed net foreign portfolio investment inflow of ~$532.2mn vs. ~$1,057mn for the full year of 2013. 28-Jan Week ended Jan 30, 2014 2,326.4 Market Indicators Abu Dhabi Trading value during the week increased by 0.8% to reach QR2.32bn vs. QR2.31bn in the prior week. The Banks & Financial Services sector led the trading value during the week, accounting for 33.3% of the total equity trading value. Trading volume decreased by 12.0% to reach 42.6mn shares vs. 48.4mn shares in the prior week. The number of transaction fell by 5.6% to reach 24,068 transactions versus 25,492 transactions in the prior week. The Banks & Financial Services sector also led the trading volume, accounting for 30.5% of the total. 27-Jan Volume Bahrain During the week, Masraf Al Rayan (MARK), Al Khalij Commercial Bank (KCBK) and Qatar International Islamic Bank (QIIK) reported 4Q2013 results. MARK reported a net income to shareholders of QR452.0mn in 4Q2013 versus QR429.5mn in 3Q2013. The bank increased its full year cash dividend per share (DPS) to QR1.50 vs. QR1.00 in 2012. KCBK registered a net profit of QR152.7mn in 4Q2013 (FY2013: QR550.9mn), an increase of 41.8% QoQ and 14.2% YoY. KCBK maintained cash DPS of QR1.00 in 2013. While QIIK posted a net profit (to equity) of QR181.8mn in 4Q2013 vs. our estimate of QR191.4mn. Profitability was dented by an impairment loss in investment securities of QR51.7mn in 4Q2013 vs. QR4.8mn in the first nine months of 2013. QIIK‟s board has recommended the distribution of cash dividend of QR3.75 per share, to its shareholders vs. QR3.50 in 2012. 11,155.73 11,170.25 Kuwait The Qatar Exchange (QE) Index declined 182.68 points, or 1.61%, during the trading week, to close at 11,155.73 points. Market capitalization decreased by 1.53% to reach QR589.4 billion (bn) as compared to QR598.5bn at the end of the previous week. Of the 42 listed companies, 14 companies ended the week higher while and 28 fell. Mannai Corporation (MCCS) was the best performing stock with a gain of 7.69% on 17.1 million (mn) shares traded. On the other hand, Ooredoo (ORDS) was the worst performing stock with a decline of 5.64% on only 947.2mn shares traded. Saudi Arabia Market Review and Outlook Exchange Mkt. Cap. ($ mn) TTM P/E** P/B** Dividend Yield 161,895.0 77,095.77 131,258.5 477,434.6# 110,244.9 25,481.2 50,489.1 14.0 19.3 12.8 17.6 17.0 11.0 8.5 1.9 1.4 1.6 2.2 1.2 1.6 0.9 4.1 2.4 3.9 3.4 3.6 3.7 3.7 # Source: Bloomberg, country exchanges and Zawya (** Trailing Twelve Months; * Value traded ($ mn) do not include special trades, if any) ( Data as of Jan. 29, 2014) Page 1 of 5
- 2. News Market & Corporate News Qatar tops frontier markets for first time – Qatar has secured Bloomberg Markets' top ranking in the "most promising emerging and frontier markets for investors in 2014" category. The magazine's March 2014 issue will reveal its third annual ranking for this category, which shows the UAE and Saudi Arabia in the lead besides Qatar jumping to the top among the frontier markets for the first time. The surge of the three Gulf nations has been led by their respective construction and retail sectors. Qatar will be spending $180bn for building infrastructure to host the FIFA World Cup in 2022. (GulfTimes.com) MARK’s net profit up 5.2% QoQ in 4Q2013 – Masraf Al Rayan (MARK) reported a net income to shareholders of QR452.0mn vs. our estimate of QR436.8mn and Bloomberg consensus of QR440.0mn. On a QoQ basis, the bottom-line is up 5.2% versus QR429.5mn in 3Q2013. The growth primarily came on the back of reversals in provisions on financing assets, which stood at QR26.2mn in the first nine months of 2013 versus a reversal of QR11.3mn for full year 2013. The bank increased its cash dividend to QR1.50 for 2013. MARK posted a full year net profit of QR1.7bn in 2013, up 13.2% YoY. EPS stood at QR2.27 in 2013. The bank‟s total assets rose to QR66.5bn in 2013, indicating an 8.0% YoY growth. Financing activities reached QR41.4bn, down 0.7% YoY, while total customer deposits rose to QR48.3bn, an increase of 7.4% YoY. MARK has recently acquired the majority stake in Islamic Bank of Britain (IBB) from QIIK. IBB is one of the few standalone Islamic retail banks in the UK and has a high street presence with five branches and ~50,000 customers. Furthermore, MARK has also expressed its intention to buy a 40% stake in a Libyan bank. The acquisition will cost around QR1bn. Both these transaction are in line with our view that the bank will expand for long-term growth potential. (QNBFS Research, QE) KCBK’s net profit rises 41.8% QoQ in 4Q2013; declares 10% cash dividend – Core banking income along with net reversals drives KCBK's net profit QoQ and YoY. Al Khaliji registered a net profit of QR152.7mn in 4Q2013 (FY2013: QR550.9mn), an increase of 41.8% QoQ and 14.2% YoY. FY2013 net income exceeded our estimate by 6.8% (BBG consensus ex-QNBFS: QR383mn). Net interest income gained by an impressive 15.5% YoY to reach QR590.4mn. Headline NIM dropped to 1.71% vs. 1.82% in 2012. However, when we look at the NIM on an adjusted basis, it appears that KCBK's NIM increased by ~3bps. Moreover, fees & commissions surprised on the upside, surging by 95.2% YoY to rest at QR142.8mn (FY2012: QR73.1mn). Another positive surprise stemmed from FX income. The bank posted QR26.4mn vs. a loss of QR12.1mn in 2012. On the other hand, investment income plummeted by 55.2%, reaching QR174.5mn vs. QR389.7mn in 2012. OPEX ticked up by 2.5% YoY to reach QR382.8mn (FY2012: QR373.3mn). Thus, the cost-to-income ratio increased to 40.6% (FY2012: 38.5%). Finally, a determining factor to KCBK's profitability was a net reversal of QR11.9mn vs. a net provision of QR61.1mn in 2012. RoAE slightly gained from 9.3% to 9.7% in 2013 (management's 3year target: 15%). The bank's loan book surged by 58.8% (QR20.7bn) while deposits expanded 14.8% (QR19.9bn). Thus, KCBK‟s LDR increased to 104% vs. 75% in 2012. Asset quality remains intact with the bank ending 2013 with NPL and coverage ratios of 0.34% and 322.9%, respectively. We expect KCBK to expand its loan book by 20.2% and 20.1% in 2014 and 2015, respectively. This along with a marginal pick up in NIMs should translate into bottom-line growth of 10.1% and 14.8% in 2014 (QR606.7mn) and 2015 (QR696.5mn), respectively. (QNBFS Research, QE) QIIK reports QR750mn net profit in 2013; recommends QR3.75 dividend – Qatar International Islamic Bank‟s (QIIK) annual net profit reached QR750mn for FY2013, growth of 10.5% YoY. Bloomberg consensus estimate was QR732mn. The bank earned total revenues of QR1.5bn in 2013. EPS reached QR4.96 in 2013 as compared to QR4.49 in 2012. QIIK‟s board has recommended the distribution of cash dividend of 37.5% of the nominal value share, QR3.75 per share, to its shareholders vs. QR3.50 in 2012. (Peninsula Qatar) VFQS reports in-line revenue and improved profitability in 3QFY14 – Vodafone Qatar (VFQS) reported revenue of QR507.1mn for 3QFY2014 (+9% QoQ, +28% YoY), only 1% shy of our estimate of QR512.7mn; BBG consensus was QR495.0mn. Quarterly ARPU of QR127 was slightly higher than our estimate, while reported mobile subscribers of 1,273,000 was modestly lower. Around 80% of the sequential growth in mobile service revenue was driven by customer growth with the remaining stemming from ARPU expansion helped by data and postpaid (~10% of overall subs); handset sales also increased QoQ. Net loss narrowed sequentially to QR53.3mn vs. our estimate of QR66.4mn and BBG consensus of QR70.0mn. Direct costs and depreciation expenses dropped below our expectations, causing the majority of this divergence. EBITDA for the quarter came in at QR134.0mn (26.4% margin versus 23.7% and 21.6% in the September and June quarters, respectively). Management guided to the top-end of previous guidance range for FY14; we retain our above consensus estimates. During the earnings conference call, VFQS management guided to the top-end of the range (QR1.901.95bn) for FY14 revenue and EBITDA (QR435-470mn). Our current modeled estimate is QR1.96bn (BBG consensus: QR1.90bn) for FY14 revenue and QR465mn (BBG consensus: QR446mn) for FY14 EBITDA. We will shortly adjust our model to account for 3QFY14 and are likely to reduce our FY14 net loss estimate of QR274mn. Finally, we continue to expect VFQS to pay QR0.10 in dividends per share in FY2014. (QNBFS Research, QE) Nakilat secures QR2.44bn refinancing from QNB Group – Qatar Gas Transport Company Ltd. (Nakilat) has secured a QR2.44bn facility with QNB Group for the refinancing of its two existing LNG vessels and the purchase of two new LNG vessels by its joint venture, Maran Nakilat Company. This is the second refinancing that Nakilat has secured for its joint venture. Through the two transactions, Nakilat has arranged a combined total of QR4.84bn in refinancing for its Maran Nakilat JV. The two vessels being added to the Maran Nakilat fleet are currently under construction in South Korea. These vessels will carry LNG cargoes from Qatar across the world. (Gulf-Times.com) MPHC’s initial share offer oversubscribed 5 times – Qatar Petroleum (QP), Mesaieed Petrochemical Holding Company‟s (MPHC) parent company, said MPHC‟s IPO has been oversubscribed five times. The maximum number of shares allocated to individual investors is 1,633, in accordance with the allocation policy set out in MPHC‟s prospectus, which will start trading on the Qatar Exchange in February. (Gulf-Times.com) QNCD reports net profit of QR436mn in 2013 – Qatar National Cement Company (QNCD) has reported a net profit of QR436mn in 2013 as compared to QR425.3mn in 2012. (QE) Page 2 of 5
- 3. Qatar Exchange Top 5 Gainers Top 5 Decliners 0.0% 12.0% 8.0% 7.7% -3.0% 7.2% -3.3% 5.4% 2.7% -6.0% Qatar International Islamic Bank Commercial Bank of Qatar 2.5 Gulf International Services Barwa Real Estate -4.3% Widam Food Co. 4.8% 4.0% Al Khaliji 2.6 -4.4% -3.1% -5.6% 0.0% Mannai Corp. Qatar Cinema Gulf & Film Warehousing Distribution Qatar Insurance Zad Holding Ooredoo Source: Qatar Exchange (QE) Source: Qatar Exchange (QE) Most Active Shares by Value (QR Million) Most Active Shares by Volume (Million) 600.0 400.0 -9.0% 9.0 360.4 6.0 4.7 207.9 206.8 200.0 3.1 172.8 143.2 0.0 2.9 3.0 0.0 Industries Qatar Gulf International Services QNB Group Commercial Bank of Qatar Source: Qatar Exchange (QE) Ooredoo Vodafone Qatar Masraf Al Rayan United Development Source: Qatar Exchange (QE) Investor Trading Percentage to Total Value Traded Net Traded Value by Nationality (QR Million) 170 100% 35.46% 28.91% Non-Qatari 925 80% 1,095 10.83% 60% 11.59% 16.81% 18.93% 40% 20% 36.14% (170) 41.32% Qatari 1,402 1,232 0% Buy Sell Qatari Individuals Qatari Institutions Non-Qatari Individuals Non-Qatari Institutions Source: Qatar Exchange (QE) (400) (200) - 200 Net Investment 400 600 800 Total Sold 1,000 1,200 1,400 1,600 Total Bought Source: Qatar Exchange (QE) Page 3 of 5
- 4. TECHNICAL ANALYSIS OF THE QE INDEX Source: Bloomberg The QE index snapped its three-week winning streak to close the week down 1.6% at 11,155.73. The index, after ending last week on a strong note, witnessed selling pressure early this week and moved back below its trendline resistance level, as it fell on four of the five trading days. The QE index has now breached below its support level of 11,170. In addition, the index has also closed near the lowest point of the week, suggesting that we may see further selling pressure. The RSI has begun to retreat from the overbought zone, while the MACD has given a negative crossover signal. Thus, with both technical indicators suggesting weakness, we believe the QE Index is likely to fall further from the current levels. The psychological level of 11,000 will the next important level for the market. The 21-day moving average, currently at 10,992, will also be a strong support zone. The next strong support below this is seen only near 10,870. However, on the upside, 11,170 will be the immediate resistance level. DEFINITIONS OF KEY TERMS USED IN TECHNICAL ANALYSIS RSI (Relative Strength Index) indicator – RSI is a momentum oscillator that measures the speed and change of price movements. The RSI oscillates between 0 to 100. The index is deemed to be overbought once the RSI approaches the 70 level, indicating that a correction is likely. On the other hand, if the RSI approaches 30, it is an indication that the index may be getting oversold and therefore likely to bounce back. MACD (Moving Average Convergence Divergence) indicator – The indicator consists of the MACD line and a signal line. The divergence or the convergence of the MACD line with the signal line indicates the strength in the momentum during the uptrend or downtrend, as the case may be. When the MACD crosses the signal line from below and trades above it, it gives a positive indication. The reverse is the situation for a bearish trend. Candlestick chart – A candlestick chart is a price chart that displays the high, low, open, and close for a security. The „body‟ of the chart is portion between the open and close price, while the high and low intraday movements form the „shadow‟. The candlestick may represent any time frame. We use a one-day candlestick chart (every candlestick represents one trading day) in our analysis. Doji candlestick pattern – A Doji candlestick is formed when a security's open and close are practically equal. The pattern indicates indecisiveness, and based on preceding price actions and future confirmation, may indicate a bullish or bearish trend reversal. Shooting Star/Inverted Hammer candlestick patterns – These candlestick patterns have a small real body (open price and close price are near to each other), and a long upper shadow (large intraday movement on the upside). The Shooting Star is a bearish reversal pattern that forms after a rally. The Inverted Hammer looks exactly like a Shooting Star, but forms after a downtrend. Inverted Hammers represent a potential bullish trend reversal. Page 4 of 5
- 5. Price % Change 5(Jan 30) Day % Change YTD Market Cap. QR Million TTM P/E P/B Div. Yield 184.50 (1.86) 7.27 129,100 13.6 2.4 3.3 Qatar Islamic Bank 74.90 (0.93) 8.55 17,698 13.3 1.5 5.0 Commercial Bank of Qatar 71.90 (3.10) 1.55 17,791 10.2 1.3 8.3 Doha Bank 64.00 (1.84) 9.97 16,536 11.1 1.5 6.5 Al Ahli Bank 63.80 (2.74) 16.00 8,107 15.4 2.3 4.7 Qatar International Islamic Bank 67.70 (4.38) 9.72 10,248 13.7 1.9 5.2 Masraf Al Rayan 34.70 (1.00) 10.86 26,025 15.3 2.6 2.9 Al Khaliji Bank 20.45 (3.31) 2.30 7,362 13.4 1.3 4.9 National Leasing 30.95 1.81 2.65 1,531 17.6 1.2 6.5 Dlala Holding 22.60 (1.14) 2.26 502 N/M 2.2 N/A Qatar & Oman Investment 12.60 (1.56) 0.64 397 26.4 1.2 4.0 Islamic Holding Group 45.95 (0.76) (0.11) 184 20.3 3.1 2.5 Company Name Qatar National Bank 235,482 Banking and Financial Services Zad Holding 72.00 2.71 3.60 942 9.6 0.7 5.6 Qatar German Co. for Medical Devices 14.20 1.07 2.53 164 N/M 0.9 N/A Salam International Investment 13.50 2.66 3.77 1,543 12.0 0.9 5.2 Medicare Group 53.00 (0.19) 0.95 1,492 24.3 1.9 3.4 Qatar Cinema & Film Distribution 43.00 7.23 7.23 246 32.8 1.8 4.7 287.00 (0.31) 1.02 18,646 15.6 3.1 3.5 51.00 (4.32) (1.35) 918 15.3 3.8 7.8 2,934 20.1 2.3 5.5 Qatar Fuel Qatar Meat and Livestock 146.70 Al Meera Consumer Goods 1.52 10.05 26,884 Consumer Goods and Services 51.80 (2.45) 2.37 2,051 9.7 1.5 5.8 Qatar National Cement 117.00 (1.68) (1.68) 5,745 13.2 2.3 5.1 Industries Qatar 179.80 (0.88) 6.45 108,779 13.4 3.4 4.3 48.15 (0.62) 10.18 5,986 25.7 2.8 1.6 181.50 (0.82) (0.22) 18,150 12.0 3.2 4.0 Qatar Industrial Manufacturing Qatari Investors Group Qatar Electricity and Water Mannai Corp. 98.00 7.69 9.01 4,471 9.7 1.9 4.8 Aamal 14.73 0.07 (1.80) 8,838 14.0 1.3 N/A Gulf International Services 75.50 2.30 23.77 11,225 18.5 3.9 2.0 165,245 Industrials Qatar Insurance 78.10 4.83 17.44 10,031 12.3 1.9 2.6 Doha Insurance 30.00 0.17 20.00 772 11.5 1.4 3.0 Qatar General Insurance & Reinsurance 45.00 1.12 (6.05) 2,594 3.0 0.8 1.9 Al Khaleej Takaful Insurance 39.10 (1.01) 7.12 668 13.9 1.1 2.1 Qatar Islamic Insurance 62.40 (1.42) 7.77 936 14.7 3.4 5.6 15,000 Insurance United Development 22.61 (2.71) 0.00 7,625 9.3 0.7 4.4 Barwa Real Estate 31.25 (2.50) 4.87 12,160 17.8 0.9 4.8 Ezdan Real Estate 16.80 (0.88) (1.18) 44,562 N/M 1.6 0.8 Mazaya Qatar Real Estate Development 12.20 0.33 9.12 1,220 18.4 1.1 4.9 65,567 Real Estate 149.00 (5.64) 8.60 47,728 18.1 1.9 3.4 11.42 (1.13) 6.63 9,654 N/M 1.6 N/A Qatar Navigation (Milaha) 88.00 (3.08) 6.02 10,078 10.3 0.8 4.3 Gulf Warehousing 43.20 5.37 4.10 2,055 20.2 2.5 N/A Qatar Gas Transport (Nakilat) Transportation 20.82 (1.05) 2.81 11,659 15.3 3.3 4.8 Qatar Telecom Vodafone Qatar 57,382 Telecoms 23,792 Qatar Exchange 589,352 Source: Bloomberg Contacts Saugata Sarkar Ahmed M. Shehada Keith Whitney Sahbi Kasraoui Head of Research Head of Trading Head of Sales Manager - HNWI Tel: (+974) 4476 6534 Tel: (+974) 4476 6535 Tel: (+974) 4476 6533 Tel: (+974) 4476 6544 saugata.sarkar@qnbfs.com.qa ahmed.shehada@qnbfs.com.qa keith.whitney@qnbfs.com.qa sahbi.alkasraoui@qnbfs.com.qa QNB Financial Services SPC Contact Center: (+974) 4476 6666 PO Box 24025, Doha, Qatar DISCLAIMER: This publication has been prepared by QNB Financial Services SPC (“QNBFS”) a wholly-owned subsidiary of Qatar National Bank (“QNB”). QNBFS is regulated by the Qatar Financial Markets Authority and the Qatar Exchange; QNB is regulated by the Qatar Central Bank. This publication expresses the views and opinions of QNBFS at a given time only. It is not an offer, promotion or recommendation to buy or sell securities or other investments, nor is it intended to constitute legal, tax, accounting, or financial advice. We therefore strongly advise potential investors to seek independent professional advice before making any investment decision. Although the information in this report has been obtained from sources that QNBFS believes to be reliable, we have not independently verified such information and it may not be accurate or complete. While this publication has been prepared with the utmost degree of care by our analysts, QNBFS does not make any representations warranties as to the accuracy and completeness of the information it may contain, and declines any liability in that respect. QNBFS reserves the right to amend the views and opinions expressed in this publication at any time. It may also express viewpoints or make investment decisions that differ significantly from, or even contradict, the views and opinions included in this report. COPYRIGHT: No part of this document may be reproduced without the explicit written permission of QNBFS. Page 5 of 5