SlideShare a Scribd company logo
1 of 6
Download to read offline
`
Page 1 of 6
Market Review and Outlook QSE Index and Volume
The Qatar Stock Exchange (QSE) Index increased by 114.63
points, or 0.95% during the week, to close at 12,164.48. Market
capitalization increased by 1.06% to reach QR653.76 billion (bn) as
compared to QR646.93 billion at the end of the previous week. Of the
43 listed companies, 23 companies ended the week higher, while 19
fell and 1 remained unchanged. Al Meera Consumer Goods Co.
(MERS) was the best performing stock for the week, with a gain of
8.77% on 198,197 shares traded. On the other hand, Dlala Brokerage
& Investments Holding Co. (DBIS) was the worst performing stock with
a decline of 6.47% on 824,613 shares traded.
QNB Group (QNBK), Industries Qatar (IQCD) and Qatar Electricity
& Water Co. (QEWS) were positive contributors to the weekly
index gain. QNBK was the biggest contributor to the index’s weekly
increase, adding 45.39 points to the index’s weekly gain of 114.63
points. IQCD contributed 20.93 points to the weekly index gain.
Further, QEWS also contributed a 17.91 points to the index’s weekly
appreciation. On the other hand, Qatar Islamic Bank (QIBK), Masraf
Al Rayan (MARK) and Ooredoo (ORDS) contributed negatively to the
index. QIBK and MARK shaved off 13.09 and 8.82 points from the
index, respectively.
Trading value during the week increased by 41.51% to reach
QR2.42bn vs. QR1.71bn in the prior week. The Real Estate sector
led the trading value during the week, accounting for 28.83% of the
total trading value. the Banks & Financial Services sector was the
second biggest contributor to the overall trading value, accounting for
27.00% of the total trading value. Barwa Real Estate Co. (BRES) was
the top value traded stock during the week with total traded value of
QR498.46mn.
Trading volume increased by 29.97% to reach 55.68mn shares vs.
42.85mn shares in the prior week. The number of transactions
increased by 16.39% to reach 28,228 transactions versus 24,253
transactions in the prior week. The Real Estate sector led the trading
volume, accounting for 36.52%, followed by the Banks & Financial
Services sector, which accounted for 20.77% of the overall trading
volume. BRES was also the top volume traded stock during the week
with total traded volume of 9.74mn shares.
Foreign institutions remained bullish during the week with net
buying of QR76.5mn vs. buying of QR66.7mn in the prior week.
Qatari institutions remained bullish with net buying of QR32.4mn vs net
buying of QR74.1mn the week before. Foreign retail investors
remained bearish for the week with net selling of QR42.1mn vs. net
selling of QR49.3mn in the prior week. Qatari retail investors remained
bearish with net selling of QR66.8mn vs. net selling of QR91.7mn the
week before. In 2015 YTD, foreign institutions sold (on a net basis)
~$56mn worth of Qatari equities.
Market Indicators
Week ended
April 30, 2015
Week ended
April 23, 2015
Chg. %
Value Traded (QR mn) 2,420.8 1,710.6 41.5
Exch. Market Cap. (QR mn) 653,762.4 646,931.2 1.1
Volume (mn) 55.7 42.8 30.0
Number of Transactions 28,228 24,253 16.4
Companies Traded 43 43 0.0
Market Breadth 23:19 24:18 –
Market Indices Close WTD% MTD% YTD%
Total Return 18,904.24 1.0 3.9 3.2
All Share Index 3,250.66 1.0 3.7 3.2
Banks/Financial Svcs. 3,241.35 0.5 2.2 1.2
Industrials 4,038.32 1.6 4.0 (0.0)
Transportation 2,503.00 1.8 3.9 8.0
Real Estate 2,621.39 0.9 9.4 16.8
Insurance 4,185.24 2.1 0.0 5.7
Telecoms 1,304.90 (1.4) (1.6) (12.2)
Consumer 7,355.43 1.9 6.5 6.5
Al Rayan Islamic Index 4,617.29 1.2 8.0 12.6
Market Indices
Weekly Index Performance
Regional Indices Close WTD% MTD% YTD%
Weekly Exchange
Traded Value ($ mn)
Exchange Mkt.
Cap. ($ mn)
TTM P/E** P/B** Dividend Yield
Qatar (QSE)* 12,164.48 1.0 3.9 (1.0) 665.05 179,588.5 12.7 1.9 4.2
Dubai 4,229.04 3.4 20.3 12.1 1,803.28 101,448.5#
9.5 1.6 5.1
Abu Dhabi 4,647.12 0.3 4.0 2.6 514.48 124,962.3 11.7 1.5 4.7
Saudi Arabia#
9,812.40 2.1 11.8 17.7 14,216.68 573,665.8 20.7 2.4 2.8
Kuwait 6,377.00 0.7 1.5 (2.4) 340.17 98,955.6 17.4 1.1 4.0
Oman 6,322.50 (0.6) 1.4 (0.3) 70.81 24,125.0 10.2 1.4 4.4
Bahrain 1,390.61 (0.5) (4.1) (2.5) 7.86 21,746.0 9.1 0.9 5.1
Source: Bloomberg, country exchanges and Zawya (** Trailing Twelve Months; * Value traded ($ mn) do not include special trades, if any;
#
Data as of April 29, 2015)
12,040.06
12,192.21
12,209.54
12,248.35
12,164.48
0
10,000,000
20,000,000
11,900
12,100
12,300
26-Apr 27-Apr 28-Apr 29-Apr 30-Apr
Volume QSE Index
3.4%
2.1%
1.0% 0.7% 0.3%
(0.5%) (0.6%)
(2.0%)
0.0%
2.0%
4.0%
Dubai
SaudiArabia
Qatar(QSE)*
Kuwait
AbuDhabi
Bahrain
Oman
Page 2 of 6
News
Economic News
 ORDS’ net profit plunges 43% YoY to QR501mn in 1Q2015
– Ooredoo’s (ORDS) net profit in 1Q2015 plunged 43% YoY to
QR501mn. Group’s profit was impacted by adverse currency
movements primarily due to the depreciation of the Algerian
Dinar and the Indonesian Rupiah. Revenue for 1Q2015 stood
at QR8,037mn, reflecting a decrease of 1% YoY. The company
reported a 5% YoY decline in its EBITDA to QR3,205mn in
1Q2015, while the EBITDA margin fell to 40% in 1Q2015 from
42% in 1Q2014. The group’s customer base rose by 14% YoY
to 111mn in 1Q2015, driven by Indonesia, Myanmar and
Algeria markets. ORDS’ data revenue for 1Q2015 increased to
30% of the group’s total revenue supported by investment in its
broadband networks, data infrastructure, driving smart phone
penetration and creating innovative new bundles and data
offers for customers. EPS amounted to QR1.56 in 1Q2015 as
compared to QR2.77 in 1Q2014. (Company Press Release)
 QNNS net profit edges up YoY to QR364.5mn in 1Q2015 –
Milaha reported a net income of QR364.5mn; in-line with our
estimate of QR370.3mn (variation of 1.6%). Net income moved
up by 4.3% YoY (59.6% QoQ) to QR364.5mn in 1Q2015 on the
back of robust core earnings. The company’s operating
revenues grew 12.4% YoY to QR785.7mn, while operating
profit grew by 2.1% YoY to QR279.2mn. Milaha’s core
segments – maritime & logistics; gas & petrochemical as well
as offshore – improved their combined bottom-line by 69.8%
YoY. The continued strong growth in trade volumes, driven by
the ramp-up in project activity in Qatar, resulted in a 25%
increase in revenue and a 174.9% increase in net profit for
Milaha Maritime & Logistics. Gas & Petrochemical segment’s
revenue jumped 39% and net profit rose by 45.1%, on the back
of robust performance of its fully owned and operated product
tanker and gas carriers as well as higher VLGC rates relative to
1Q2014. In addition, the segment benefited from the full-year
effect of 19 harbor vessels, some of which were received
through mid-2014. Further, Milaha Offshore fared significantly
well, driven by the steep decline in oil prices and the cutbacks
on capital spending by oil majors globally. However, Milaha
Capital was negatively impacted by the volatility in Qatar’s
equities market in 1Q2015, with its net income dropping by
30.7%. (QNBFS Research, Gulf-Times.com)
 UDCD posts near fourfold rise in net profit from 4Q2014 –
United Development Company’s (UDCD) bottom-line soared
292.9% QoQ in 1Q2015 to QR261.8mn. The net profit also
registered an increase of 8.5% YoY even as the top-line
dropped 17.5% YoY to QR399.7mn. The company reported
other income of QR97.9mn, registering an increase of
QR77.7mn from 1Q2014, which mainly aided the yearly profit
growth. UDCD’s Chairman and Managing Director, Turki Al
Khater highlighted that the continued focus on project delivery
of premium residential and commercial units at The Pearl-
Qatar, as well as the successful investment in strategic
partnerships resulted the company in delivering good quarterly
results. (QSE, Peninsula Qatar)
 BRES net profits soars 1,127.6% YoY to QR3.25bn in
1Q2015 – Barwa Real Estate Company's (BRES) net profit
soared 1,127.6% YoY (jumped 54.7% QoQ) to QR3.25bn in
1Q2015. BRES booked a one-off QR2.7bn as profit on sale of
properties in 1Q2015, which mainly led to the exponential profit
growth. Further, a higher net fair value gain from investment
properties (up 135.5% YoY to QR309.9mn in 1Q2015) and
income from consultancy & other services (up 37.9% YoY to
QR133.6mn in 1Q2015) also aided the net income growth.
However, the rental income declined 24.6% YoY and 57.9%
QoQ to QR258.0mn in 1Q2015. (QSE)
 MRDS reveals QR26mn net profit in 1Q2015 – Mazaya Qatar
Real Estate Development Company (MRDS) revealed a net
profit of QR26mn in 1Q2015 as compared to QR22.3mn in
1Q2014. The EPS in 1Q2015 amounted to QR0.26 versus
QR0.22 in 1Q2014. (QSE)
 QGMD reports net loss of QR3.8mn in 1Q2015 – Qatari
German Company for Medical Devices (QGMD) posted a net
loss of QR3.8mn in 1Q2015 as compared to a net loss of
QR2.8mn in 1Q2014. The Loss per Share (LPS) amounted to
QR0.333 versus LPS of QR0.243 in 1Q2014. (QSE)
 ZHCD reports QR53.9mn net profit in 1Q2015 – Zad Holding
Company (ZHCD) reported a net profit of QR53.9mn in 1Q2015
as compared to QR46.4mn in 1Q2014. The company’s EPS
amounted to QR2.50 in 1Q2015 versus QR2.16 in 1Q2014.
(QSE)
 ERES’ net profit surges 51.3% QoQ in 1Q2015 – Ezdan
Holding Group (ERES) reported a net profit of QR522.5mn,
surging 51.3% QoQ while a faster growth in rents and dividend
income helped the net income to rise by 13.4% YoY in 1Q2015.
Rental income grew 20.3% YoY (down 2.3% QoQ) to
QR362.9mn whereas dividend income from ‘available-for-sale’
financial assets gained by 13.6% YoY to QR183.6mn. ERES’
share from results of ‘equity-accounted investees’ rose 16.7%
to QR75.3mn which further contributed to YoY net profit rise.
ERES’ CEO Ali Al-Obaidli said the group will launch other
projects in 2015, including “Ezdan Palace” hotel that would
feature 210 guest rooms and suites. He also highlighted plans
to enhance operational efficiency in some of ERES’ prime
assets, including the group’s hotels in Al Dafna. (QSE, Gulf-
Times.com)
 AHCS posts net profit of QR103mn in 1Q2015 – Aamal
Company (AHCS) posted a net profit attributable to
shareholders of QR103mn in 1Q2015, an increase of 24.5%
YoY (down 65.5% on a QoQ basis), led by margin expansion
and robust performance of its realty development. The
company’s net underlying profit margins (excluding share of
profits of equity accounted for investments in associates and
joint ventures) improved to 16.5% in 1Q2015 as against 13.3%
in 1Q2014. AHCS’ Chairman Sheikh Faisal bin Qassim Al-
Thani said the property division achieved a revenue growth of
almost 19%, accompanied by a strengthening in margin. The
revenue marginally declined 0.5% YoY to QR635.6mn (up
18.0% QoQ). The EPS amounted to QR0.16 in 1Q2015 as
compared to QR0.13 in 1Q2014. (Company Press Release,
Gulf-Times.com)
 QIGD reveals QR63mn net profit in 1Q2015 – Qatari
Investors Group (QIGD) posted a net profit of QR63mn in
1Q2015 as compared to QR58.6mn in 1Q2014. The EPS
amounted to QR0.51 in 1Q2015 versus QR0.47 in 1Q2014.
(QSE)
 Fitch affirms 6 Qatari Banks at 'A+'; Affirms QNBK at 'AA-'
– Fitch Ratings has affirmed the Long-term Issuer Default
Ratings (LT IDR) of Commercial Bank of Qatar (CBQK), Doha
Bank (DHBK), Qatar Islamic Bank (QIBK), Al Khalij Commercial
Bank (KCBK) , Qatar International Islamic Bank (QIIK) and Ahli
Bank (ABQK) at 'A+'. Fitch has also affirmed QNB Group’s
(QNBK) LT IDR at 'AA-'. The outlooks on all the LT IDRs are
Stable. (Reuters)
Page 3 of 6
Qatar Stock Exchange
Top Gainers Top Decliners
Source: Qatar Stock Exchange (QSE) Source: Qatar Stock Exchange (QSE)
Most Active Shares by Value (QR Million) Most Active Shares by Volume (Million)
Source: Qatar Stock Exchange (QSE) Source: Qatar Stock Exchange (QSE)
Investor Trading Percentage to Total Value Traded Net Traded Value by Nationality (QR Million)
Source: Qatar Stock Exchange (QSE)
8.8%
6.6%
5.6%
4.0% 4.0%
0.0%
3.0%
6.0%
9.0%
Al Meera
Consumer
Goods
Gulf
Warehousing
Islamic
Holding Group
Qatar
Electricity and
Water
United
Development
-6.5%
-5.8%
-4.3%
-2.4% -2.3%
-9.0%
-6.0%
-3.0%
0.0%
Dlala Holding Qatar German
Co. for Medical
Devices
Al Ahli Bank Zad Holding Doha Insurance
498.5
268.5
174.5
128.1 118.8
0.0
170.0
340.0
510.0
Barwa Real
Estate
Gulf
International
Services
QNB Group Masraf Al
Rayan
Industries
Qatar
9.7
6.1
5.5
4.4
3.0
0.0
4.0
8.0
12.0
Barwa Real
Estate
Vodafone Qatar Ezdan Real
Estate
Salam
International
Investment
Gulf
International
Services
0%
20%
40%
60%
80%
100%
Buy Sell
46.18% 48.94%
18.49% 17.15%
13.24% 14.98%
22.09% 18.93%
Qatari Individuals Qatari Institutions
Non-Qatari Individuals Non-Qatari Institutions
1,566
855
1,600
821
(34)
34
(200) - 200 400 600 800 1,000 1,200 1,400 1,600 1,800
Qatari
Non-Qatari
Net Investment Total Sold Total Bought
Page 4 of 6
TECHNICAL ANALYSIS OF THE QSE INDEX
Source: Bloomberg
The QSE Index increased by almost 1% since last week’s closing. The Index is steadily marking its way above the clear long-term trend line. Traded volume
is increasing gradually which is a positive confirmation to the up-move. In addition, the MACD shows that it is turning up and that indicates more positive
momentum could be building up. It is worth mentioning that the Index is crawling up and still in a short-term range. Thus, the immediate resistance level is
located around 12,600 on the weekly frame. On the flipside of the coin, the support level is positioned at 11,700.
DEFINITIONS OF KEY TERMS USED IN TECHNICAL ANALYSIS
RSI (Relative Strength Index) indicator – RSI is a momentum oscillator that measures the speed and change of price movements. The RSI oscillates
between 0 to 100. The index is deemed to be overbought once the RSI approaches the 70 level, indicating that a correction is likely. On the other hand, if
the RSI approaches 30, it is an indication that the index may be getting oversold and therefore likely to bounce back.
MACD (Moving Average Convergence Divergence) indicator – The indicator consists of the MACD line and a signal line. The divergence or the
convergence of the MACD line with the signal line indicates the strength in the momentum during the uptrend or downtrend, as the case may be. When the
MACD crosses the signal line from below and trades above it, it gives a positive indication. The reverse is the situation for a bearish trend.
Candlestick chart – A candlestick chart is a price chart that displays the high, low, open, and close for a security. The ‘body’ of the chart is portion between
the open and close price, while the high and low intraday movements form the ‘shadow’. The candlestick may represent any time frame. We use a one-day
candlestick chart (every candlestick represents one trading day) in our analysis.
Doji candlestick pattern – A Doji candlestick is formed when a security's open and close are practically equal. The pattern indicates indecisiveness, and
based on preceding price actions and future confirmation, may indicate a bullish or bearish trend reversal.
Shooting Star/Inverted Hammer candlestick patterns – These candlestick patterns have a small real body (open price and close price are near to each
other), and a long upper shadow (large intraday movement on the upside). The Shooting Star is a bearish reversal pattern that forms after a rally. The
Inverted Hammer looks exactly like a Shooting Star, but forms after a downtrend. Inverted Hammers represent a potential bullish trend reversal.
Page 5 of 6
Source: Bloomberg
Company Name
Price
(April 30)
% Change 5-
Day
% Change
YTD
Market Cap.
QR Million TTM P/E P/B Div. Yield
Qatar National Bank 198.00 2.59 (7.00) 138,546 12.9 2.6 3.8
Qatar Islamic Bank 100.50 (1.95) (1.66) 23,747 14.4 2.3 4.2
Commercial Bank of Qatar 56.40 (0.18) (9.43) 18,422 10.3 1.1 5.6
Doha Bank 54.70 1.48 (4.04) 14,133 10.3 1.3 7.3
Al Ahli Bank 46.40 (4.33) (6.52) 8,432 13.6 2.1 2.9
Qatar International Islamic Bank 81.00 0.62 (0.86) 12,261 14.7 2.5 4.9
Masraf Al Rayan 48.50 (0.72) 9.73 36,375 17.5 3.4 3.6
Al Khaliji Bank 20.49 (1.49) (7.07) 7,376 12.3 1.3 4.9
National Leasing 21.56 (2.22) 7.80 1,067 24.7 0.9 3.9
Dlala Holding 28.80 (6.49) (13.87) 818 14.5 2.8 N/A
Qatar & Oman Investment 15.65 1.62 1.62 493 16.1 1.4 5.1
Islamic Holding Group 121.70 5.55 (2.25) 487 29.4 8.2 2.5
Banking and Financial Services 262,158
Zad Holding 90.80 (2.37) 8.10 1,188 10.7 1.5 4.4
Qatar German Co. for Medical Devices 13.00 (5.80) 28.08 150 N/A 0.9 N/A
Salam International Investment 13.90 2.21 (12.30) 1,589 19.9 1.0 4.3
Medicare Group 172.10 2.62 47.09 4,844 24.6 5.8 1.0
Qatar Cinema & Film Distribution 42.10 (0.71) 5.25 264 21.2 1.8 2.2
Qatar Fuel 180.00 0.28 (11.89) 15,203 13.3 2.5 5.0
Qatar Meat and Livestock 61.50 0.82 1.82 1,107 20.5 4.1 4.1
Al Meera Consumer Goods 246.90 8.77 23.45 4,938 21.4 3.9 3.6
Consumer Goods and Services 29,283
Qatar Industrial Manufacturing 45.60 (0.87) 5.19 2,167 14.1 1.4 6.6
Qatar National Cement 121.50 2.19 1.25 6,562 15.8 2.6 3.0
Industries Qatar 145.10 1.47 (13.63) 87,786 15.4 2.9 4.8
Qatari Investors Group 47.90 (0.21) 15.70 5,955 25.8 2.7 1.6
Qatar Electricity and Water 212.10 3.97 13.12 23,331 14.4 3.8 3.5
Mannai Corp. 114.20 3.72 4.77 5,210 9.6 2.5 5.3
Aamal 16.27 (1.39) 12.47 10,250 17.3 1.4 5.9
Gulf International Services 89.20 2.88 (8.14) 16,577 10.5 4.7 6.2
Mesaieed Petrochemical Holding 26.25 0.19 -11.0 32,978 22.8 2.5 4.2
Industrials 190,816
Qatar Insurance 80.70 3.46 2.43 14,899 15.2 2.6 2.7
Doha Insurance 25.30 (2.32) (12.76) 1,265 11.7 1.2 4.0
Qatar General Insurance & Reinsurance 56.50 0.00 10.13 4,495 4.9 0.8 3.1
Al Khaleej Takaful Insurance 43.30 1.17 (1.98) 1,105 14.8 1.8 3.0
Qatar Islamic Insurance 82.00 (0.49) 3.80 1,230 14.7 4.0 4.9
Insurance 22,994
United Development 22.56 3.96 (4.37) 7,988 14.8 0.8 5.5
Barw a Real Estate 50.20 1.52 19.81 19,534 3.3 1.1 4.4
Ezdan Real Estate 17.00 (0.06) 13.94 45,092 31.7 1.5 2.4
Mazaya Qatar Real Estate Development 18.87 (0.68) 3.46 1,981 11.4 1.5 1.5
Real Estate 74,596
Qatar Telecom 99.50 (1.29) (19.69) 31,872 18.2 1.4 4.0
Vodafone Qatar 16.90 (1.69) 2.74 14,287 N/A 2.6 1.0
Telecoms 46,159
Qatar Navigation (Milaha) 100.80 1.41 1.31 11,544 10.8 0.9 5.5
Gulf Warehousing 72.90 6.58 29.26 3,467 22.9 4.0 2.1
Qatar Gas Transport (Nakilat) 22.76 0.89 (1.47) 12,746 13.9 4.3 5.3
Transportation 27,757
Qatar Exchange 653,762
Contacts
Saugata Sarkar Sahbi Kasraoui QNB Financial Services SPC
Head of Research Head of HNI Contact Center: (+974) 4476 6666
Tel: (+974) 4476 6534 Tel: (+974) 4476 6544 PO Box 24025
saugata.sarkar@qnbfs.com.qa sahbi.alkasraoui@qnbfs.com.qa Doha, Qatar
Disclaimer and Copyright Notice: This publication has been prepared by QNB Financial Services SPC (“QNBFS”) a wholly-owned subsidiary of QNB SAQ (“QNB”). QNBFS is regulated by the
Qatar Financial Markets Authority and the Qatar Exchange QNB SAQ is regulated by the Qatar Central Bank. This publication expresses the views and opinions of QNBFS at a given time only. It is
not an offer, promotion or recommendation to buy or sell securities or other investments, nor is it intended to constitute legal, tax, accounting, or financial advice. QNBFS accepts no liability
whatsoever for any direct or indirect losses arising from use of this report. Any investment decision should depend on the individual circumstances of the investor and be based on specifically
engaged investment advice. We therefore strongly advise potential investors to seek independent professional advice before making any investment decision. Although the information in this report
has been obtained from sources that QNBFS believes to be reliable, we have not independently verified such information and it may not be accurate or complete. QNBFS does not make any
representations or warranties as to the accuracy and completeness of the information it may contain, and declines any liability in that respect. For reports dealing with Technical Analysis,
expressed opinions and/or recommendations may be different or contrary to the opinions/recommendations of QNBFS Fundamental Research as a result of depending solely on the historical
technical data (price and volume). QNBFS reserves the right to amend the views and opinions expressed in this publication at any time. It may also express viewpoints or make investment
decisions that differ significantly from, or even contradict, the views and opinions included in this report. This report may not be reproduced in whole or in part without permission from QNBFS
COPYRIGHT: No part of this document may be reproduced without the explicit written permission of QNBFS.
Page 6 of 6

More Related Content

What's hot

26 June Technical Market Report
26 June Technical Market Report26 June Technical Market Report
26 June Technical Market ReportQNB Group
 
28 August Daily Market Report
28 August Daily Market Report 28 August Daily Market Report
28 August Daily Market Report QNB Group
 
Weekly market report
Weekly market reportWeekly market report
Weekly market reportQNB Group
 
9 October Daily Market Report
9 October Daily Market Report 9 October Daily Market Report
9 October Daily Market Report QNB Group
 
2 June Daily market report
2 June Daily market report 2 June Daily market report
2 June Daily market report QNB Group
 
Weekly market report
Weekly market report Weekly market report
Weekly market report QNB Group
 
Weekly market report
Weekly market reportWeekly market report
Weekly market reportQNB Group
 
QNBFS Daily Market Report October 19, 2021
QNBFS Daily Market Report October 19, 2021QNBFS Daily Market Report October 19, 2021
QNBFS Daily Market Report October 19, 2021QNB Group
 
QNBFS Daily Market Report November 11, 2021
QNBFS Daily Market Report November 11, 2021QNBFS Daily Market Report November 11, 2021
QNBFS Daily Market Report November 11, 2021QNB Group
 
1 July Daily market report
1 July Daily market report 1 July Daily market report
1 July Daily market report QNB Group
 
QNBFS Weekly Market Report August 10, 2017
QNBFS Weekly Market Report August 10, 2017QNBFS Weekly Market Report August 10, 2017
QNBFS Weekly Market Report August 10, 2017QNB Group
 
2 June Daily Market Report
2 June Daily Market Report2 June Daily Market Report
2 June Daily Market ReportQNB Group
 
11 July Technical Market Report
11 July Technical Market Report11 July Technical Market Report
11 July Technical Market ReportQNB Group
 
24 June Technical Market Report
24 June Technical Market Report24 June Technical Market Report
24 June Technical Market ReportQNB Group
 
5 March Daily market report
5 March Daily market report5 March Daily market report
5 March Daily market reportQNB Group
 
QNBFS Daily Market Report October 24, 2021
QNBFS Daily Market Report October 24, 2021QNBFS Daily Market Report October 24, 2021
QNBFS Daily Market Report October 24, 2021QNB Group
 
16 April Daily market report
16 April Daily market report 16 April Daily market report
16 April Daily market report QNB Group
 
Weekly market report
Weekly market report Weekly market report
Weekly market report QNB Group
 
QNBFS Weekly Market Report November 11, 2021
QNBFS Weekly Market Report November 11, 2021QNBFS Weekly Market Report November 11, 2021
QNBFS Weekly Market Report November 11, 2021QNB Group
 
Weekly market report
Weekly market reportWeekly market report
Weekly market reportQNB Group
 

What's hot (20)

26 June Technical Market Report
26 June Technical Market Report26 June Technical Market Report
26 June Technical Market Report
 
28 August Daily Market Report
28 August Daily Market Report 28 August Daily Market Report
28 August Daily Market Report
 
Weekly market report
Weekly market reportWeekly market report
Weekly market report
 
9 October Daily Market Report
9 October Daily Market Report 9 October Daily Market Report
9 October Daily Market Report
 
2 June Daily market report
2 June Daily market report 2 June Daily market report
2 June Daily market report
 
Weekly market report
Weekly market report Weekly market report
Weekly market report
 
Weekly market report
Weekly market reportWeekly market report
Weekly market report
 
QNBFS Daily Market Report October 19, 2021
QNBFS Daily Market Report October 19, 2021QNBFS Daily Market Report October 19, 2021
QNBFS Daily Market Report October 19, 2021
 
QNBFS Daily Market Report November 11, 2021
QNBFS Daily Market Report November 11, 2021QNBFS Daily Market Report November 11, 2021
QNBFS Daily Market Report November 11, 2021
 
1 July Daily market report
1 July Daily market report 1 July Daily market report
1 July Daily market report
 
QNBFS Weekly Market Report August 10, 2017
QNBFS Weekly Market Report August 10, 2017QNBFS Weekly Market Report August 10, 2017
QNBFS Weekly Market Report August 10, 2017
 
2 June Daily Market Report
2 June Daily Market Report2 June Daily Market Report
2 June Daily Market Report
 
11 July Technical Market Report
11 July Technical Market Report11 July Technical Market Report
11 July Technical Market Report
 
24 June Technical Market Report
24 June Technical Market Report24 June Technical Market Report
24 June Technical Market Report
 
5 March Daily market report
5 March Daily market report5 March Daily market report
5 March Daily market report
 
QNBFS Daily Market Report October 24, 2021
QNBFS Daily Market Report October 24, 2021QNBFS Daily Market Report October 24, 2021
QNBFS Daily Market Report October 24, 2021
 
16 April Daily market report
16 April Daily market report 16 April Daily market report
16 April Daily market report
 
Weekly market report
Weekly market report Weekly market report
Weekly market report
 
QNBFS Weekly Market Report November 11, 2021
QNBFS Weekly Market Report November 11, 2021QNBFS Weekly Market Report November 11, 2021
QNBFS Weekly Market Report November 11, 2021
 
Weekly market report
Weekly market reportWeekly market report
Weekly market report
 

Similar to Weekly market report

Weekly market report
Weekly market reportWeekly market report
Weekly market reportQNB Group
 
Weekly Market Report
Weekly Market ReportWeekly Market Report
Weekly Market ReportQNB Group
 
Weekly market report
Weekly market report Weekly market report
Weekly market report QNB Group
 
Weekly market report
Weekly market reportWeekly market report
Weekly market reportQNB Group
 
QNBFS Weekly Market Report February 7, 2019
QNBFS Weekly Market Report February 7, 2019QNBFS Weekly Market Report February 7, 2019
QNBFS Weekly Market Report February 7, 2019QNB Group
 
Weekly market report
Weekly market reportWeekly market report
Weekly market reportQNB Group
 
Weekly market report
Weekly market reportWeekly market report
Weekly market reportQNB Group
 
Weekly market report
Weekly market reportWeekly market report
Weekly market reportQNB Group
 
Weekly market report
Weekly market reportWeekly market report
Weekly market reportQNB Group
 
QNBFS Weekly Market Report April 25, 2019
QNBFS Weekly Market Report April 25, 2019QNBFS Weekly Market Report April 25, 2019
QNBFS Weekly Market Report April 25, 2019QNB Group
 
Weekly market report
Weekly market reportWeekly market report
Weekly market reportQNB Group
 
QNBFS Weekly Market Report July 26, 2018.
QNBFS Weekly Market Report July 26, 2018. QNBFS Weekly Market Report July 26, 2018.
QNBFS Weekly Market Report July 26, 2018. QNB Group
 
Weekly market report
Weekly market reportWeekly market report
Weekly market reportQNB Group
 
Weekly market report
Weekly market report Weekly market report
Weekly market report QNB Group
 
Weekly market report
Weekly market report Weekly market report
Weekly market report QNB Group
 
QNBFS Weekly Market Report July 19, 2018
QNBFS Weekly Market Report July 19, 2018 QNBFS Weekly Market Report July 19, 2018
QNBFS Weekly Market Report July 19, 2018 QNB Group
 
Weekly market report
Weekly market report Weekly market report
Weekly market report QNB Group
 
Weekly market report
Weekly market reportWeekly market report
Weekly market reportQNB Group
 
QNBFS Weekly Market Report May 18, 2017
QNBFS Weekly Market Report May 18, 2017QNBFS Weekly Market Report May 18, 2017
QNBFS Weekly Market Report May 18, 2017QNB Group
 
Weekly market report
Weekly market report Weekly market report
Weekly market report QNB Group
 

Similar to Weekly market report (20)

Weekly market report
Weekly market reportWeekly market report
Weekly market report
 
Weekly Market Report
Weekly Market ReportWeekly Market Report
Weekly Market Report
 
Weekly market report
Weekly market report Weekly market report
Weekly market report
 
Weekly market report
Weekly market reportWeekly market report
Weekly market report
 
QNBFS Weekly Market Report February 7, 2019
QNBFS Weekly Market Report February 7, 2019QNBFS Weekly Market Report February 7, 2019
QNBFS Weekly Market Report February 7, 2019
 
Weekly market report
Weekly market reportWeekly market report
Weekly market report
 
Weekly market report
Weekly market reportWeekly market report
Weekly market report
 
Weekly market report
Weekly market reportWeekly market report
Weekly market report
 
Weekly market report
Weekly market reportWeekly market report
Weekly market report
 
QNBFS Weekly Market Report April 25, 2019
QNBFS Weekly Market Report April 25, 2019QNBFS Weekly Market Report April 25, 2019
QNBFS Weekly Market Report April 25, 2019
 
Weekly market report
Weekly market reportWeekly market report
Weekly market report
 
QNBFS Weekly Market Report July 26, 2018.
QNBFS Weekly Market Report July 26, 2018. QNBFS Weekly Market Report July 26, 2018.
QNBFS Weekly Market Report July 26, 2018.
 
Weekly market report
Weekly market reportWeekly market report
Weekly market report
 
Weekly market report
Weekly market report Weekly market report
Weekly market report
 
Weekly market report
Weekly market report Weekly market report
Weekly market report
 
QNBFS Weekly Market Report July 19, 2018
QNBFS Weekly Market Report July 19, 2018 QNBFS Weekly Market Report July 19, 2018
QNBFS Weekly Market Report July 19, 2018
 
Weekly market report
Weekly market report Weekly market report
Weekly market report
 
Weekly market report
Weekly market reportWeekly market report
Weekly market report
 
QNBFS Weekly Market Report May 18, 2017
QNBFS Weekly Market Report May 18, 2017QNBFS Weekly Market Report May 18, 2017
QNBFS Weekly Market Report May 18, 2017
 
Weekly market report
Weekly market report Weekly market report
Weekly market report
 

More from QNB Group

QNBFS Daily Market Report December 24, 2023
QNBFS Daily Market Report December 24, 2023QNBFS Daily Market Report December 24, 2023
QNBFS Daily Market Report December 24, 2023QNB Group
 
QNBFS Daily Market Report November 29, 2023
QNBFS Daily Market Report November 29, 2023QNBFS Daily Market Report November 29, 2023
QNBFS Daily Market Report November 29, 2023QNB Group
 
QNBFS Weekly Market Report November 23, 2023
QNBFS Weekly Market Report November 23, 2023QNBFS Weekly Market Report November 23, 2023
QNBFS Weekly Market Report November 23, 2023QNB Group
 
QNBFS Weekly Market Report November 16, 2023
QNBFS Weekly Market Report November 16, 2023QNBFS Weekly Market Report November 16, 2023
QNBFS Weekly Market Report November 16, 2023QNB Group
 
QNBFS Daily Technical Trader Qatar - November 14, 2023 التحليل الفني اليومي ل...
QNBFS Daily Technical Trader Qatar - November 14, 2023 التحليل الفني اليومي ل...QNBFS Daily Technical Trader Qatar - November 14, 2023 التحليل الفني اليومي ل...
QNBFS Daily Technical Trader Qatar - November 14, 2023 التحليل الفني اليومي ل...QNB Group
 
QNBFS Daily Technical Trader Qatar - November 06, 2023 التحليل الفني اليومي ل...
QNBFS Daily Technical Trader Qatar - November 06, 2023 التحليل الفني اليومي ل...QNBFS Daily Technical Trader Qatar - November 06, 2023 التحليل الفني اليومي ل...
QNBFS Daily Technical Trader Qatar - November 06, 2023 التحليل الفني اليومي ل...QNB Group
 
QNBFS Daily Market Report October 30, 2023
QNBFS Daily Market Report October 30, 2023QNBFS Daily Market Report October 30, 2023
QNBFS Daily Market Report October 30, 2023QNB Group
 
QNBFS Daily Technical Trader Qatar - October 25, 2023 التحليل الفني اليومي لب...
QNBFS Daily Technical Trader Qatar - October 25, 2023 التحليل الفني اليومي لب...QNBFS Daily Technical Trader Qatar - October 25, 2023 التحليل الفني اليومي لب...
QNBFS Daily Technical Trader Qatar - October 25, 2023 التحليل الفني اليومي لب...QNB Group
 
QNBFS Daily Technical Trader Qatar - October 10, 2023 التحليل الفني اليومي لب...
QNBFS Daily Technical Trader Qatar - October 10, 2023 التحليل الفني اليومي لب...QNBFS Daily Technical Trader Qatar - October 10, 2023 التحليل الفني اليومي لب...
QNBFS Daily Technical Trader Qatar - October 10, 2023 التحليل الفني اليومي لب...QNB Group
 
QNBFS Daily Technical Trader Qatar - October 11, 2023 التحليل الفني اليومي لب...
QNBFS Daily Technical Trader Qatar - October 11, 2023 التحليل الفني اليومي لب...QNBFS Daily Technical Trader Qatar - October 11, 2023 التحليل الفني اليومي لب...
QNBFS Daily Technical Trader Qatar - October 11, 2023 التحليل الفني اليومي لب...QNB Group
 
QNBFS Daily Technical Trader Qatar - October 10, 2023 التحليل الفني اليومي لب...
QNBFS Daily Technical Trader Qatar - October 10, 2023 التحليل الفني اليومي لب...QNBFS Daily Technical Trader Qatar - October 10, 2023 التحليل الفني اليومي لب...
QNBFS Daily Technical Trader Qatar - October 10, 2023 التحليل الفني اليومي لب...QNB Group
 
QNBFS Daily Market Report October 04, 2023
QNBFS Daily Market Report October 04, 2023QNBFS Daily Market Report October 04, 2023
QNBFS Daily Market Report October 04, 2023QNB Group
 
QNBFS Daily Technical Trader Qatar - October 04, 2023 التحليل الفني اليومي لب...
QNBFS Daily Technical Trader Qatar - October 04, 2023 التحليل الفني اليومي لب...QNBFS Daily Technical Trader Qatar - October 04, 2023 التحليل الفني اليومي لب...
QNBFS Daily Technical Trader Qatar - October 04, 2023 التحليل الفني اليومي لب...QNB Group
 
QNBFS Daily Technical Trader Qatar - September 28, 2023 التحليل الفني اليومي ...
QNBFS Daily Technical Trader Qatar - September 28, 2023 التحليل الفني اليومي ...QNBFS Daily Technical Trader Qatar - September 28, 2023 التحليل الفني اليومي ...
QNBFS Daily Technical Trader Qatar - September 28, 2023 التحليل الفني اليومي ...QNB Group
 
QNBFS Daily Market Report September 24, 2023
QNBFS Daily Market Report September 24, 2023QNBFS Daily Market Report September 24, 2023
QNBFS Daily Market Report September 24, 2023QNB Group
 
QNBFS Daily Technical Trader Qatar - September 24, 2023 التحليل الفني اليومي ...
QNBFS Daily Technical Trader Qatar - September 24, 2023 التحليل الفني اليومي ...QNBFS Daily Technical Trader Qatar - September 24, 2023 التحليل الفني اليومي ...
QNBFS Daily Technical Trader Qatar - September 24, 2023 التحليل الفني اليومي ...QNB Group
 
QNBFS Daily Technical Trader Qatar - September 19, 2023 التحليل الفني اليومي ...
QNBFS Daily Technical Trader Qatar - September 19, 2023 التحليل الفني اليومي ...QNBFS Daily Technical Trader Qatar - September 19, 2023 التحليل الفني اليومي ...
QNBFS Daily Technical Trader Qatar - September 19, 2023 التحليل الفني اليومي ...QNB Group
 
QNBFS Daily Market Report September 17, 2023
QNBFS Daily Market Report September 17, 2023QNBFS Daily Market Report September 17, 2023
QNBFS Daily Market Report September 17, 2023QNB Group
 
QNBFS Weekly Market Report September 07, 2023
QNBFS Weekly Market Report September 07, 2023QNBFS Weekly Market Report September 07, 2023
QNBFS Weekly Market Report September 07, 2023QNB Group
 
QNBFS Daily Technical Trader Qatar - September 07, 2023 التحليل الفني اليومي ...
QNBFS Daily Technical Trader Qatar - September 07, 2023 التحليل الفني اليومي ...QNBFS Daily Technical Trader Qatar - September 07, 2023 التحليل الفني اليومي ...
QNBFS Daily Technical Trader Qatar - September 07, 2023 التحليل الفني اليومي ...QNB Group
 

More from QNB Group (20)

QNBFS Daily Market Report December 24, 2023
QNBFS Daily Market Report December 24, 2023QNBFS Daily Market Report December 24, 2023
QNBFS Daily Market Report December 24, 2023
 
QNBFS Daily Market Report November 29, 2023
QNBFS Daily Market Report November 29, 2023QNBFS Daily Market Report November 29, 2023
QNBFS Daily Market Report November 29, 2023
 
QNBFS Weekly Market Report November 23, 2023
QNBFS Weekly Market Report November 23, 2023QNBFS Weekly Market Report November 23, 2023
QNBFS Weekly Market Report November 23, 2023
 
QNBFS Weekly Market Report November 16, 2023
QNBFS Weekly Market Report November 16, 2023QNBFS Weekly Market Report November 16, 2023
QNBFS Weekly Market Report November 16, 2023
 
QNBFS Daily Technical Trader Qatar - November 14, 2023 التحليل الفني اليومي ل...
QNBFS Daily Technical Trader Qatar - November 14, 2023 التحليل الفني اليومي ل...QNBFS Daily Technical Trader Qatar - November 14, 2023 التحليل الفني اليومي ل...
QNBFS Daily Technical Trader Qatar - November 14, 2023 التحليل الفني اليومي ل...
 
QNBFS Daily Technical Trader Qatar - November 06, 2023 التحليل الفني اليومي ل...
QNBFS Daily Technical Trader Qatar - November 06, 2023 التحليل الفني اليومي ل...QNBFS Daily Technical Trader Qatar - November 06, 2023 التحليل الفني اليومي ل...
QNBFS Daily Technical Trader Qatar - November 06, 2023 التحليل الفني اليومي ل...
 
QNBFS Daily Market Report October 30, 2023
QNBFS Daily Market Report October 30, 2023QNBFS Daily Market Report October 30, 2023
QNBFS Daily Market Report October 30, 2023
 
QNBFS Daily Technical Trader Qatar - October 25, 2023 التحليل الفني اليومي لب...
QNBFS Daily Technical Trader Qatar - October 25, 2023 التحليل الفني اليومي لب...QNBFS Daily Technical Trader Qatar - October 25, 2023 التحليل الفني اليومي لب...
QNBFS Daily Technical Trader Qatar - October 25, 2023 التحليل الفني اليومي لب...
 
QNBFS Daily Technical Trader Qatar - October 10, 2023 التحليل الفني اليومي لب...
QNBFS Daily Technical Trader Qatar - October 10, 2023 التحليل الفني اليومي لب...QNBFS Daily Technical Trader Qatar - October 10, 2023 التحليل الفني اليومي لب...
QNBFS Daily Technical Trader Qatar - October 10, 2023 التحليل الفني اليومي لب...
 
QNBFS Daily Technical Trader Qatar - October 11, 2023 التحليل الفني اليومي لب...
QNBFS Daily Technical Trader Qatar - October 11, 2023 التحليل الفني اليومي لب...QNBFS Daily Technical Trader Qatar - October 11, 2023 التحليل الفني اليومي لب...
QNBFS Daily Technical Trader Qatar - October 11, 2023 التحليل الفني اليومي لب...
 
QNBFS Daily Technical Trader Qatar - October 10, 2023 التحليل الفني اليومي لب...
QNBFS Daily Technical Trader Qatar - October 10, 2023 التحليل الفني اليومي لب...QNBFS Daily Technical Trader Qatar - October 10, 2023 التحليل الفني اليومي لب...
QNBFS Daily Technical Trader Qatar - October 10, 2023 التحليل الفني اليومي لب...
 
QNBFS Daily Market Report October 04, 2023
QNBFS Daily Market Report October 04, 2023QNBFS Daily Market Report October 04, 2023
QNBFS Daily Market Report October 04, 2023
 
QNBFS Daily Technical Trader Qatar - October 04, 2023 التحليل الفني اليومي لب...
QNBFS Daily Technical Trader Qatar - October 04, 2023 التحليل الفني اليومي لب...QNBFS Daily Technical Trader Qatar - October 04, 2023 التحليل الفني اليومي لب...
QNBFS Daily Technical Trader Qatar - October 04, 2023 التحليل الفني اليومي لب...
 
QNBFS Daily Technical Trader Qatar - September 28, 2023 التحليل الفني اليومي ...
QNBFS Daily Technical Trader Qatar - September 28, 2023 التحليل الفني اليومي ...QNBFS Daily Technical Trader Qatar - September 28, 2023 التحليل الفني اليومي ...
QNBFS Daily Technical Trader Qatar - September 28, 2023 التحليل الفني اليومي ...
 
QNBFS Daily Market Report September 24, 2023
QNBFS Daily Market Report September 24, 2023QNBFS Daily Market Report September 24, 2023
QNBFS Daily Market Report September 24, 2023
 
QNBFS Daily Technical Trader Qatar - September 24, 2023 التحليل الفني اليومي ...
QNBFS Daily Technical Trader Qatar - September 24, 2023 التحليل الفني اليومي ...QNBFS Daily Technical Trader Qatar - September 24, 2023 التحليل الفني اليومي ...
QNBFS Daily Technical Trader Qatar - September 24, 2023 التحليل الفني اليومي ...
 
QNBFS Daily Technical Trader Qatar - September 19, 2023 التحليل الفني اليومي ...
QNBFS Daily Technical Trader Qatar - September 19, 2023 التحليل الفني اليومي ...QNBFS Daily Technical Trader Qatar - September 19, 2023 التحليل الفني اليومي ...
QNBFS Daily Technical Trader Qatar - September 19, 2023 التحليل الفني اليومي ...
 
QNBFS Daily Market Report September 17, 2023
QNBFS Daily Market Report September 17, 2023QNBFS Daily Market Report September 17, 2023
QNBFS Daily Market Report September 17, 2023
 
QNBFS Weekly Market Report September 07, 2023
QNBFS Weekly Market Report September 07, 2023QNBFS Weekly Market Report September 07, 2023
QNBFS Weekly Market Report September 07, 2023
 
QNBFS Daily Technical Trader Qatar - September 07, 2023 التحليل الفني اليومي ...
QNBFS Daily Technical Trader Qatar - September 07, 2023 التحليل الفني اليومي ...QNBFS Daily Technical Trader Qatar - September 07, 2023 التحليل الفني اليومي ...
QNBFS Daily Technical Trader Qatar - September 07, 2023 التحليل الفني اليومي ...
 

Recently uploaded

Classical Theory of Macroeconomics by Adam Smith
Classical Theory of Macroeconomics by Adam SmithClassical Theory of Macroeconomics by Adam Smith
Classical Theory of Macroeconomics by Adam SmithAdamYassin2
 
Financial Leverage Definition, Advantages, and Disadvantages
Financial Leverage Definition, Advantages, and DisadvantagesFinancial Leverage Definition, Advantages, and Disadvantages
Financial Leverage Definition, Advantages, and Disadvantagesjayjaymabutot13
 
Mulki Call Girls 7001305949 WhatsApp Number 24x7 Best Services
Mulki Call Girls 7001305949 WhatsApp Number 24x7 Best ServicesMulki Call Girls 7001305949 WhatsApp Number 24x7 Best Services
Mulki Call Girls 7001305949 WhatsApp Number 24x7 Best Servicesnajka9823
 
(办理原版一样)QUT毕业证昆士兰科技大学毕业证学位证留信学历认证成绩单补办
(办理原版一样)QUT毕业证昆士兰科技大学毕业证学位证留信学历认证成绩单补办(办理原版一样)QUT毕业证昆士兰科技大学毕业证学位证留信学历认证成绩单补办
(办理原版一样)QUT毕业证昆士兰科技大学毕业证学位证留信学历认证成绩单补办fqiuho152
 
Q3 2024 Earnings Conference Call and Webcast Slides
Q3 2024 Earnings Conference Call and Webcast SlidesQ3 2024 Earnings Conference Call and Webcast Slides
Q3 2024 Earnings Conference Call and Webcast SlidesMarketing847413
 
AfRESFullPaper22018EmpiricalPerformanceofRealEstateInvestmentTrustsandShareho...
AfRESFullPaper22018EmpiricalPerformanceofRealEstateInvestmentTrustsandShareho...AfRESFullPaper22018EmpiricalPerformanceofRealEstateInvestmentTrustsandShareho...
AfRESFullPaper22018EmpiricalPerformanceofRealEstateInvestmentTrustsandShareho...yordanosyohannes2
 
(办理学位证)加拿大萨省大学毕业证成绩单原版一比一
(办理学位证)加拿大萨省大学毕业证成绩单原版一比一(办理学位证)加拿大萨省大学毕业证成绩单原版一比一
(办理学位证)加拿大萨省大学毕业证成绩单原版一比一S SDS
 
Lundin Gold April 2024 Corporate Presentation v4.pdf
Lundin Gold April 2024 Corporate Presentation v4.pdfLundin Gold April 2024 Corporate Presentation v4.pdf
Lundin Gold April 2024 Corporate Presentation v4.pdfAdnet Communications
 
Vp Girls near me Delhi Call Now or WhatsApp
Vp Girls near me Delhi Call Now or WhatsAppVp Girls near me Delhi Call Now or WhatsApp
Vp Girls near me Delhi Call Now or WhatsAppmiss dipika
 
Financial institutions facilitate financing, economic transactions, issue fun...
Financial institutions facilitate financing, economic transactions, issue fun...Financial institutions facilitate financing, economic transactions, issue fun...
Financial institutions facilitate financing, economic transactions, issue fun...Avanish Goel
 
Instant Issue Debit Cards - High School Spirit
Instant Issue Debit Cards - High School SpiritInstant Issue Debit Cards - High School Spirit
Instant Issue Debit Cards - High School Spiritegoetzinger
 
fca-bsps-decision-letter-redacted (1).pdf
fca-bsps-decision-letter-redacted (1).pdffca-bsps-decision-letter-redacted (1).pdf
fca-bsps-decision-letter-redacted (1).pdfHenry Tapper
 
Instant Issue Debit Cards - School Designs
Instant Issue Debit Cards - School DesignsInstant Issue Debit Cards - School Designs
Instant Issue Debit Cards - School Designsegoetzinger
 
Stock Market Brief Deck for 4/24/24 .pdf
Stock Market Brief Deck for 4/24/24 .pdfStock Market Brief Deck for 4/24/24 .pdf
Stock Market Brief Deck for 4/24/24 .pdfMichael Silva
 
Andheri Call Girls In 9825968104 Mumbai Hot Models
Andheri Call Girls In 9825968104 Mumbai Hot ModelsAndheri Call Girls In 9825968104 Mumbai Hot Models
Andheri Call Girls In 9825968104 Mumbai Hot Modelshematsharma006
 
VIP Kolkata Call Girl Jodhpur Park 👉 8250192130 Available With Room
VIP Kolkata Call Girl Jodhpur Park 👉 8250192130  Available With RoomVIP Kolkata Call Girl Jodhpur Park 👉 8250192130  Available With Room
VIP Kolkata Call Girl Jodhpur Park 👉 8250192130 Available With Roomdivyansh0kumar0
 
Interimreport1 January–31 March2024 Elo Mutual Pension Insurance Company
Interimreport1 January–31 March2024 Elo Mutual Pension Insurance CompanyInterimreport1 January–31 March2024 Elo Mutual Pension Insurance Company
Interimreport1 January–31 March2024 Elo Mutual Pension Insurance CompanyTyöeläkeyhtiö Elo
 
magnetic-pensions-a-new-blueprint-for-the-dc-landscape.pdf
magnetic-pensions-a-new-blueprint-for-the-dc-landscape.pdfmagnetic-pensions-a-new-blueprint-for-the-dc-landscape.pdf
magnetic-pensions-a-new-blueprint-for-the-dc-landscape.pdfHenry Tapper
 
VIP Kolkata Call Girl Serampore 👉 8250192130 Available With Room
VIP Kolkata Call Girl Serampore 👉 8250192130  Available With RoomVIP Kolkata Call Girl Serampore 👉 8250192130  Available With Room
VIP Kolkata Call Girl Serampore 👉 8250192130 Available With Roomdivyansh0kumar0
 

Recently uploaded (20)

Classical Theory of Macroeconomics by Adam Smith
Classical Theory of Macroeconomics by Adam SmithClassical Theory of Macroeconomics by Adam Smith
Classical Theory of Macroeconomics by Adam Smith
 
Financial Leverage Definition, Advantages, and Disadvantages
Financial Leverage Definition, Advantages, and DisadvantagesFinancial Leverage Definition, Advantages, and Disadvantages
Financial Leverage Definition, Advantages, and Disadvantages
 
Mulki Call Girls 7001305949 WhatsApp Number 24x7 Best Services
Mulki Call Girls 7001305949 WhatsApp Number 24x7 Best ServicesMulki Call Girls 7001305949 WhatsApp Number 24x7 Best Services
Mulki Call Girls 7001305949 WhatsApp Number 24x7 Best Services
 
(办理原版一样)QUT毕业证昆士兰科技大学毕业证学位证留信学历认证成绩单补办
(办理原版一样)QUT毕业证昆士兰科技大学毕业证学位证留信学历认证成绩单补办(办理原版一样)QUT毕业证昆士兰科技大学毕业证学位证留信学历认证成绩单补办
(办理原版一样)QUT毕业证昆士兰科技大学毕业证学位证留信学历认证成绩单补办
 
Q3 2024 Earnings Conference Call and Webcast Slides
Q3 2024 Earnings Conference Call and Webcast SlidesQ3 2024 Earnings Conference Call and Webcast Slides
Q3 2024 Earnings Conference Call and Webcast Slides
 
AfRESFullPaper22018EmpiricalPerformanceofRealEstateInvestmentTrustsandShareho...
AfRESFullPaper22018EmpiricalPerformanceofRealEstateInvestmentTrustsandShareho...AfRESFullPaper22018EmpiricalPerformanceofRealEstateInvestmentTrustsandShareho...
AfRESFullPaper22018EmpiricalPerformanceofRealEstateInvestmentTrustsandShareho...
 
🔝+919953056974 🔝young Delhi Escort service Pusa Road
🔝+919953056974 🔝young Delhi Escort service Pusa Road🔝+919953056974 🔝young Delhi Escort service Pusa Road
🔝+919953056974 🔝young Delhi Escort service Pusa Road
 
(办理学位证)加拿大萨省大学毕业证成绩单原版一比一
(办理学位证)加拿大萨省大学毕业证成绩单原版一比一(办理学位证)加拿大萨省大学毕业证成绩单原版一比一
(办理学位证)加拿大萨省大学毕业证成绩单原版一比一
 
Lundin Gold April 2024 Corporate Presentation v4.pdf
Lundin Gold April 2024 Corporate Presentation v4.pdfLundin Gold April 2024 Corporate Presentation v4.pdf
Lundin Gold April 2024 Corporate Presentation v4.pdf
 
Vp Girls near me Delhi Call Now or WhatsApp
Vp Girls near me Delhi Call Now or WhatsAppVp Girls near me Delhi Call Now or WhatsApp
Vp Girls near me Delhi Call Now or WhatsApp
 
Financial institutions facilitate financing, economic transactions, issue fun...
Financial institutions facilitate financing, economic transactions, issue fun...Financial institutions facilitate financing, economic transactions, issue fun...
Financial institutions facilitate financing, economic transactions, issue fun...
 
Instant Issue Debit Cards - High School Spirit
Instant Issue Debit Cards - High School SpiritInstant Issue Debit Cards - High School Spirit
Instant Issue Debit Cards - High School Spirit
 
fca-bsps-decision-letter-redacted (1).pdf
fca-bsps-decision-letter-redacted (1).pdffca-bsps-decision-letter-redacted (1).pdf
fca-bsps-decision-letter-redacted (1).pdf
 
Instant Issue Debit Cards - School Designs
Instant Issue Debit Cards - School DesignsInstant Issue Debit Cards - School Designs
Instant Issue Debit Cards - School Designs
 
Stock Market Brief Deck for 4/24/24 .pdf
Stock Market Brief Deck for 4/24/24 .pdfStock Market Brief Deck for 4/24/24 .pdf
Stock Market Brief Deck for 4/24/24 .pdf
 
Andheri Call Girls In 9825968104 Mumbai Hot Models
Andheri Call Girls In 9825968104 Mumbai Hot ModelsAndheri Call Girls In 9825968104 Mumbai Hot Models
Andheri Call Girls In 9825968104 Mumbai Hot Models
 
VIP Kolkata Call Girl Jodhpur Park 👉 8250192130 Available With Room
VIP Kolkata Call Girl Jodhpur Park 👉 8250192130  Available With RoomVIP Kolkata Call Girl Jodhpur Park 👉 8250192130  Available With Room
VIP Kolkata Call Girl Jodhpur Park 👉 8250192130 Available With Room
 
Interimreport1 January–31 March2024 Elo Mutual Pension Insurance Company
Interimreport1 January–31 March2024 Elo Mutual Pension Insurance CompanyInterimreport1 January–31 March2024 Elo Mutual Pension Insurance Company
Interimreport1 January–31 March2024 Elo Mutual Pension Insurance Company
 
magnetic-pensions-a-new-blueprint-for-the-dc-landscape.pdf
magnetic-pensions-a-new-blueprint-for-the-dc-landscape.pdfmagnetic-pensions-a-new-blueprint-for-the-dc-landscape.pdf
magnetic-pensions-a-new-blueprint-for-the-dc-landscape.pdf
 
VIP Kolkata Call Girl Serampore 👉 8250192130 Available With Room
VIP Kolkata Call Girl Serampore 👉 8250192130  Available With RoomVIP Kolkata Call Girl Serampore 👉 8250192130  Available With Room
VIP Kolkata Call Girl Serampore 👉 8250192130 Available With Room
 

Weekly market report

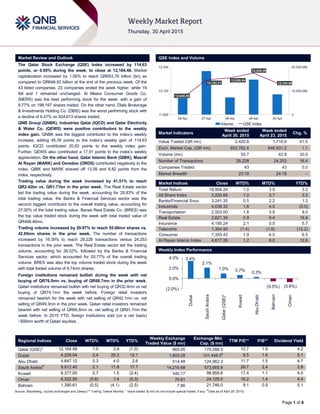
  • 1. ` Page 1 of 6 Market Review and Outlook QSE Index and Volume The Qatar Stock Exchange (QSE) Index increased by 114.63 points, or 0.95% during the week, to close at 12,164.48. Market capitalization increased by 1.06% to reach QR653.76 billion (bn) as compared to QR646.93 billion at the end of the previous week. Of the 43 listed companies, 23 companies ended the week higher, while 19 fell and 1 remained unchanged. Al Meera Consumer Goods Co. (MERS) was the best performing stock for the week, with a gain of 8.77% on 198,197 shares traded. On the other hand, Dlala Brokerage & Investments Holding Co. (DBIS) was the worst performing stock with a decline of 6.47% on 824,613 shares traded. QNB Group (QNBK), Industries Qatar (IQCD) and Qatar Electricity & Water Co. (QEWS) were positive contributors to the weekly index gain. QNBK was the biggest contributor to the index’s weekly increase, adding 45.39 points to the index’s weekly gain of 114.63 points. IQCD contributed 20.93 points to the weekly index gain. Further, QEWS also contributed a 17.91 points to the index’s weekly appreciation. On the other hand, Qatar Islamic Bank (QIBK), Masraf Al Rayan (MARK) and Ooredoo (ORDS) contributed negatively to the index. QIBK and MARK shaved off 13.09 and 8.82 points from the index, respectively. Trading value during the week increased by 41.51% to reach QR2.42bn vs. QR1.71bn in the prior week. The Real Estate sector led the trading value during the week, accounting for 28.83% of the total trading value. the Banks & Financial Services sector was the second biggest contributor to the overall trading value, accounting for 27.00% of the total trading value. Barwa Real Estate Co. (BRES) was the top value traded stock during the week with total traded value of QR498.46mn. Trading volume increased by 29.97% to reach 55.68mn shares vs. 42.85mn shares in the prior week. The number of transactions increased by 16.39% to reach 28,228 transactions versus 24,253 transactions in the prior week. The Real Estate sector led the trading volume, accounting for 36.52%, followed by the Banks & Financial Services sector, which accounted for 20.77% of the overall trading volume. BRES was also the top volume traded stock during the week with total traded volume of 9.74mn shares. Foreign institutions remained bullish during the week with net buying of QR76.5mn vs. buying of QR66.7mn in the prior week. Qatari institutions remained bullish with net buying of QR32.4mn vs net buying of QR74.1mn the week before. Foreign retail investors remained bearish for the week with net selling of QR42.1mn vs. net selling of QR49.3mn in the prior week. Qatari retail investors remained bearish with net selling of QR66.8mn vs. net selling of QR91.7mn the week before. In 2015 YTD, foreign institutions sold (on a net basis) ~$56mn worth of Qatari equities. Market Indicators Week ended April 30, 2015 Week ended April 23, 2015 Chg. % Value Traded (QR mn) 2,420.8 1,710.6 41.5 Exch. Market Cap. (QR mn) 653,762.4 646,931.2 1.1 Volume (mn) 55.7 42.8 30.0 Number of Transactions 28,228 24,253 16.4 Companies Traded 43 43 0.0 Market Breadth 23:19 24:18 – Market Indices Close WTD% MTD% YTD% Total Return 18,904.24 1.0 3.9 3.2 All Share Index 3,250.66 1.0 3.7 3.2 Banks/Financial Svcs. 3,241.35 0.5 2.2 1.2 Industrials 4,038.32 1.6 4.0 (0.0) Transportation 2,503.00 1.8 3.9 8.0 Real Estate 2,621.39 0.9 9.4 16.8 Insurance 4,185.24 2.1 0.0 5.7 Telecoms 1,304.90 (1.4) (1.6) (12.2) Consumer 7,355.43 1.9 6.5 6.5 Al Rayan Islamic Index 4,617.29 1.2 8.0 12.6 Market Indices Weekly Index Performance Regional Indices Close WTD% MTD% YTD% Weekly Exchange Traded Value ($ mn) Exchange Mkt. Cap. ($ mn) TTM P/E** P/B** Dividend Yield Qatar (QSE)* 12,164.48 1.0 3.9 (1.0) 665.05 179,588.5 12.7 1.9 4.2 Dubai 4,229.04 3.4 20.3 12.1 1,803.28 101,448.5# 9.5 1.6 5.1 Abu Dhabi 4,647.12 0.3 4.0 2.6 514.48 124,962.3 11.7 1.5 4.7 Saudi Arabia# 9,812.40 2.1 11.8 17.7 14,216.68 573,665.8 20.7 2.4 2.8 Kuwait 6,377.00 0.7 1.5 (2.4) 340.17 98,955.6 17.4 1.1 4.0 Oman 6,322.50 (0.6) 1.4 (0.3) 70.81 24,125.0 10.2 1.4 4.4 Bahrain 1,390.61 (0.5) (4.1) (2.5) 7.86 21,746.0 9.1 0.9 5.1 Source: Bloomberg, country exchanges and Zawya (** Trailing Twelve Months; * Value traded ($ mn) do not include special trades, if any; # Data as of April 29, 2015) 12,040.06 12,192.21 12,209.54 12,248.35 12,164.48 0 10,000,000 20,000,000 11,900 12,100 12,300 26-Apr 27-Apr 28-Apr 29-Apr 30-Apr Volume QSE Index 3.4% 2.1% 1.0% 0.7% 0.3% (0.5%) (0.6%) (2.0%) 0.0% 2.0% 4.0% Dubai SaudiArabia Qatar(QSE)* Kuwait AbuDhabi Bahrain Oman
  • 2. Page 2 of 6 News Economic News  ORDS’ net profit plunges 43% YoY to QR501mn in 1Q2015 – Ooredoo’s (ORDS) net profit in 1Q2015 plunged 43% YoY to QR501mn. Group’s profit was impacted by adverse currency movements primarily due to the depreciation of the Algerian Dinar and the Indonesian Rupiah. Revenue for 1Q2015 stood at QR8,037mn, reflecting a decrease of 1% YoY. The company reported a 5% YoY decline in its EBITDA to QR3,205mn in 1Q2015, while the EBITDA margin fell to 40% in 1Q2015 from 42% in 1Q2014. The group’s customer base rose by 14% YoY to 111mn in 1Q2015, driven by Indonesia, Myanmar and Algeria markets. ORDS’ data revenue for 1Q2015 increased to 30% of the group’s total revenue supported by investment in its broadband networks, data infrastructure, driving smart phone penetration and creating innovative new bundles and data offers for customers. EPS amounted to QR1.56 in 1Q2015 as compared to QR2.77 in 1Q2014. (Company Press Release)  QNNS net profit edges up YoY to QR364.5mn in 1Q2015 – Milaha reported a net income of QR364.5mn; in-line with our estimate of QR370.3mn (variation of 1.6%). Net income moved up by 4.3% YoY (59.6% QoQ) to QR364.5mn in 1Q2015 on the back of robust core earnings. The company’s operating revenues grew 12.4% YoY to QR785.7mn, while operating profit grew by 2.1% YoY to QR279.2mn. Milaha’s core segments – maritime & logistics; gas & petrochemical as well as offshore – improved their combined bottom-line by 69.8% YoY. The continued strong growth in trade volumes, driven by the ramp-up in project activity in Qatar, resulted in a 25% increase in revenue and a 174.9% increase in net profit for Milaha Maritime & Logistics. Gas & Petrochemical segment’s revenue jumped 39% and net profit rose by 45.1%, on the back of robust performance of its fully owned and operated product tanker and gas carriers as well as higher VLGC rates relative to 1Q2014. In addition, the segment benefited from the full-year effect of 19 harbor vessels, some of which were received through mid-2014. Further, Milaha Offshore fared significantly well, driven by the steep decline in oil prices and the cutbacks on capital spending by oil majors globally. However, Milaha Capital was negatively impacted by the volatility in Qatar’s equities market in 1Q2015, with its net income dropping by 30.7%. (QNBFS Research, Gulf-Times.com)  UDCD posts near fourfold rise in net profit from 4Q2014 – United Development Company’s (UDCD) bottom-line soared 292.9% QoQ in 1Q2015 to QR261.8mn. The net profit also registered an increase of 8.5% YoY even as the top-line dropped 17.5% YoY to QR399.7mn. The company reported other income of QR97.9mn, registering an increase of QR77.7mn from 1Q2014, which mainly aided the yearly profit growth. UDCD’s Chairman and Managing Director, Turki Al Khater highlighted that the continued focus on project delivery of premium residential and commercial units at The Pearl- Qatar, as well as the successful investment in strategic partnerships resulted the company in delivering good quarterly results. (QSE, Peninsula Qatar)  BRES net profits soars 1,127.6% YoY to QR3.25bn in 1Q2015 – Barwa Real Estate Company's (BRES) net profit soared 1,127.6% YoY (jumped 54.7% QoQ) to QR3.25bn in 1Q2015. BRES booked a one-off QR2.7bn as profit on sale of properties in 1Q2015, which mainly led to the exponential profit growth. Further, a higher net fair value gain from investment properties (up 135.5% YoY to QR309.9mn in 1Q2015) and income from consultancy & other services (up 37.9% YoY to QR133.6mn in 1Q2015) also aided the net income growth. However, the rental income declined 24.6% YoY and 57.9% QoQ to QR258.0mn in 1Q2015. (QSE)  MRDS reveals QR26mn net profit in 1Q2015 – Mazaya Qatar Real Estate Development Company (MRDS) revealed a net profit of QR26mn in 1Q2015 as compared to QR22.3mn in 1Q2014. The EPS in 1Q2015 amounted to QR0.26 versus QR0.22 in 1Q2014. (QSE)  QGMD reports net loss of QR3.8mn in 1Q2015 – Qatari German Company for Medical Devices (QGMD) posted a net loss of QR3.8mn in 1Q2015 as compared to a net loss of QR2.8mn in 1Q2014. The Loss per Share (LPS) amounted to QR0.333 versus LPS of QR0.243 in 1Q2014. (QSE)  ZHCD reports QR53.9mn net profit in 1Q2015 – Zad Holding Company (ZHCD) reported a net profit of QR53.9mn in 1Q2015 as compared to QR46.4mn in 1Q2014. The company’s EPS amounted to QR2.50 in 1Q2015 versus QR2.16 in 1Q2014. (QSE)  ERES’ net profit surges 51.3% QoQ in 1Q2015 – Ezdan Holding Group (ERES) reported a net profit of QR522.5mn, surging 51.3% QoQ while a faster growth in rents and dividend income helped the net income to rise by 13.4% YoY in 1Q2015. Rental income grew 20.3% YoY (down 2.3% QoQ) to QR362.9mn whereas dividend income from ‘available-for-sale’ financial assets gained by 13.6% YoY to QR183.6mn. ERES’ share from results of ‘equity-accounted investees’ rose 16.7% to QR75.3mn which further contributed to YoY net profit rise. ERES’ CEO Ali Al-Obaidli said the group will launch other projects in 2015, including “Ezdan Palace” hotel that would feature 210 guest rooms and suites. He also highlighted plans to enhance operational efficiency in some of ERES’ prime assets, including the group’s hotels in Al Dafna. (QSE, Gulf- Times.com)  AHCS posts net profit of QR103mn in 1Q2015 – Aamal Company (AHCS) posted a net profit attributable to shareholders of QR103mn in 1Q2015, an increase of 24.5% YoY (down 65.5% on a QoQ basis), led by margin expansion and robust performance of its realty development. The company’s net underlying profit margins (excluding share of profits of equity accounted for investments in associates and joint ventures) improved to 16.5% in 1Q2015 as against 13.3% in 1Q2014. AHCS’ Chairman Sheikh Faisal bin Qassim Al- Thani said the property division achieved a revenue growth of almost 19%, accompanied by a strengthening in margin. The revenue marginally declined 0.5% YoY to QR635.6mn (up 18.0% QoQ). The EPS amounted to QR0.16 in 1Q2015 as compared to QR0.13 in 1Q2014. (Company Press Release, Gulf-Times.com)  QIGD reveals QR63mn net profit in 1Q2015 – Qatari Investors Group (QIGD) posted a net profit of QR63mn in 1Q2015 as compared to QR58.6mn in 1Q2014. The EPS amounted to QR0.51 in 1Q2015 versus QR0.47 in 1Q2014. (QSE)  Fitch affirms 6 Qatari Banks at 'A+'; Affirms QNBK at 'AA-' – Fitch Ratings has affirmed the Long-term Issuer Default Ratings (LT IDR) of Commercial Bank of Qatar (CBQK), Doha Bank (DHBK), Qatar Islamic Bank (QIBK), Al Khalij Commercial Bank (KCBK) , Qatar International Islamic Bank (QIIK) and Ahli Bank (ABQK) at 'A+'. Fitch has also affirmed QNB Group’s (QNBK) LT IDR at 'AA-'. The outlooks on all the LT IDRs are Stable. (Reuters)
  • 3. Page 3 of 6 Qatar Stock Exchange Top Gainers Top Decliners Source: Qatar Stock Exchange (QSE) Source: Qatar Stock Exchange (QSE) Most Active Shares by Value (QR Million) Most Active Shares by Volume (Million) Source: Qatar Stock Exchange (QSE) Source: Qatar Stock Exchange (QSE) Investor Trading Percentage to Total Value Traded Net Traded Value by Nationality (QR Million) Source: Qatar Stock Exchange (QSE) Source: Qatar Stock Exchange (QSE) 8.8% 6.6% 5.6% 4.0% 4.0% 0.0% 3.0% 6.0% 9.0% Al Meera Consumer Goods Gulf Warehousing Islamic Holding Group Qatar Electricity and Water United Development -6.5% -5.8% -4.3% -2.4% -2.3% -9.0% -6.0% -3.0% 0.0% Dlala Holding Qatar German Co. for Medical Devices Al Ahli Bank Zad Holding Doha Insurance 498.5 268.5 174.5 128.1 118.8 0.0 170.0 340.0 510.0 Barwa Real Estate Gulf International Services QNB Group Masraf Al Rayan Industries Qatar 9.7 6.1 5.5 4.4 3.0 0.0 4.0 8.0 12.0 Barwa Real Estate Vodafone Qatar Ezdan Real Estate Salam International Investment Gulf International Services 0% 20% 40% 60% 80% 100% Buy Sell 46.18% 48.94% 18.49% 17.15% 13.24% 14.98% 22.09% 18.93% Qatari Individuals Qatari Institutions Non-Qatari Individuals Non-Qatari Institutions 1,566 855 1,600 821 (34) 34 (200) - 200 400 600 800 1,000 1,200 1,400 1,600 1,800 Qatari Non-Qatari Net Investment Total Sold Total Bought
  • 4. Page 4 of 6 TECHNICAL ANALYSIS OF THE QSE INDEX Source: Bloomberg The QSE Index increased by almost 1% since last week’s closing. The Index is steadily marking its way above the clear long-term trend line. Traded volume is increasing gradually which is a positive confirmation to the up-move. In addition, the MACD shows that it is turning up and that indicates more positive momentum could be building up. It is worth mentioning that the Index is crawling up and still in a short-term range. Thus, the immediate resistance level is located around 12,600 on the weekly frame. On the flipside of the coin, the support level is positioned at 11,700. DEFINITIONS OF KEY TERMS USED IN TECHNICAL ANALYSIS RSI (Relative Strength Index) indicator – RSI is a momentum oscillator that measures the speed and change of price movements. The RSI oscillates between 0 to 100. The index is deemed to be overbought once the RSI approaches the 70 level, indicating that a correction is likely. On the other hand, if the RSI approaches 30, it is an indication that the index may be getting oversold and therefore likely to bounce back. MACD (Moving Average Convergence Divergence) indicator – The indicator consists of the MACD line and a signal line. The divergence or the convergence of the MACD line with the signal line indicates the strength in the momentum during the uptrend or downtrend, as the case may be. When the MACD crosses the signal line from below and trades above it, it gives a positive indication. The reverse is the situation for a bearish trend. Candlestick chart – A candlestick chart is a price chart that displays the high, low, open, and close for a security. The ‘body’ of the chart is portion between the open and close price, while the high and low intraday movements form the ‘shadow’. The candlestick may represent any time frame. We use a one-day candlestick chart (every candlestick represents one trading day) in our analysis. Doji candlestick pattern – A Doji candlestick is formed when a security's open and close are practically equal. The pattern indicates indecisiveness, and based on preceding price actions and future confirmation, may indicate a bullish or bearish trend reversal. Shooting Star/Inverted Hammer candlestick patterns – These candlestick patterns have a small real body (open price and close price are near to each other), and a long upper shadow (large intraday movement on the upside). The Shooting Star is a bearish reversal pattern that forms after a rally. The Inverted Hammer looks exactly like a Shooting Star, but forms after a downtrend. Inverted Hammers represent a potential bullish trend reversal.
  • 5. Page 5 of 6 Source: Bloomberg Company Name Price (April 30) % Change 5- Day % Change YTD Market Cap. QR Million TTM P/E P/B Div. Yield Qatar National Bank 198.00 2.59 (7.00) 138,546 12.9 2.6 3.8 Qatar Islamic Bank 100.50 (1.95) (1.66) 23,747 14.4 2.3 4.2 Commercial Bank of Qatar 56.40 (0.18) (9.43) 18,422 10.3 1.1 5.6 Doha Bank 54.70 1.48 (4.04) 14,133 10.3 1.3 7.3 Al Ahli Bank 46.40 (4.33) (6.52) 8,432 13.6 2.1 2.9 Qatar International Islamic Bank 81.00 0.62 (0.86) 12,261 14.7 2.5 4.9 Masraf Al Rayan 48.50 (0.72) 9.73 36,375 17.5 3.4 3.6 Al Khaliji Bank 20.49 (1.49) (7.07) 7,376 12.3 1.3 4.9 National Leasing 21.56 (2.22) 7.80 1,067 24.7 0.9 3.9 Dlala Holding 28.80 (6.49) (13.87) 818 14.5 2.8 N/A Qatar & Oman Investment 15.65 1.62 1.62 493 16.1 1.4 5.1 Islamic Holding Group 121.70 5.55 (2.25) 487 29.4 8.2 2.5 Banking and Financial Services 262,158 Zad Holding 90.80 (2.37) 8.10 1,188 10.7 1.5 4.4 Qatar German Co. for Medical Devices 13.00 (5.80) 28.08 150 N/A 0.9 N/A Salam International Investment 13.90 2.21 (12.30) 1,589 19.9 1.0 4.3 Medicare Group 172.10 2.62 47.09 4,844 24.6 5.8 1.0 Qatar Cinema & Film Distribution 42.10 (0.71) 5.25 264 21.2 1.8 2.2 Qatar Fuel 180.00 0.28 (11.89) 15,203 13.3 2.5 5.0 Qatar Meat and Livestock 61.50 0.82 1.82 1,107 20.5 4.1 4.1 Al Meera Consumer Goods 246.90 8.77 23.45 4,938 21.4 3.9 3.6 Consumer Goods and Services 29,283 Qatar Industrial Manufacturing 45.60 (0.87) 5.19 2,167 14.1 1.4 6.6 Qatar National Cement 121.50 2.19 1.25 6,562 15.8 2.6 3.0 Industries Qatar 145.10 1.47 (13.63) 87,786 15.4 2.9 4.8 Qatari Investors Group 47.90 (0.21) 15.70 5,955 25.8 2.7 1.6 Qatar Electricity and Water 212.10 3.97 13.12 23,331 14.4 3.8 3.5 Mannai Corp. 114.20 3.72 4.77 5,210 9.6 2.5 5.3 Aamal 16.27 (1.39) 12.47 10,250 17.3 1.4 5.9 Gulf International Services 89.20 2.88 (8.14) 16,577 10.5 4.7 6.2 Mesaieed Petrochemical Holding 26.25 0.19 -11.0 32,978 22.8 2.5 4.2 Industrials 190,816 Qatar Insurance 80.70 3.46 2.43 14,899 15.2 2.6 2.7 Doha Insurance 25.30 (2.32) (12.76) 1,265 11.7 1.2 4.0 Qatar General Insurance & Reinsurance 56.50 0.00 10.13 4,495 4.9 0.8 3.1 Al Khaleej Takaful Insurance 43.30 1.17 (1.98) 1,105 14.8 1.8 3.0 Qatar Islamic Insurance 82.00 (0.49) 3.80 1,230 14.7 4.0 4.9 Insurance 22,994 United Development 22.56 3.96 (4.37) 7,988 14.8 0.8 5.5 Barw a Real Estate 50.20 1.52 19.81 19,534 3.3 1.1 4.4 Ezdan Real Estate 17.00 (0.06) 13.94 45,092 31.7 1.5 2.4 Mazaya Qatar Real Estate Development 18.87 (0.68) 3.46 1,981 11.4 1.5 1.5 Real Estate 74,596 Qatar Telecom 99.50 (1.29) (19.69) 31,872 18.2 1.4 4.0 Vodafone Qatar 16.90 (1.69) 2.74 14,287 N/A 2.6 1.0 Telecoms 46,159 Qatar Navigation (Milaha) 100.80 1.41 1.31 11,544 10.8 0.9 5.5 Gulf Warehousing 72.90 6.58 29.26 3,467 22.9 4.0 2.1 Qatar Gas Transport (Nakilat) 22.76 0.89 (1.47) 12,746 13.9 4.3 5.3 Transportation 27,757 Qatar Exchange 653,762
  • 6. Contacts Saugata Sarkar Sahbi Kasraoui QNB Financial Services SPC Head of Research Head of HNI Contact Center: (+974) 4476 6666 Tel: (+974) 4476 6534 Tel: (+974) 4476 6544 PO Box 24025 saugata.sarkar@qnbfs.com.qa sahbi.alkasraoui@qnbfs.com.qa Doha, Qatar Disclaimer and Copyright Notice: This publication has been prepared by QNB Financial Services SPC (“QNBFS”) a wholly-owned subsidiary of QNB SAQ (“QNB”). QNBFS is regulated by the Qatar Financial Markets Authority and the Qatar Exchange QNB SAQ is regulated by the Qatar Central Bank. This publication expresses the views and opinions of QNBFS at a given time only. It is not an offer, promotion or recommendation to buy or sell securities or other investments, nor is it intended to constitute legal, tax, accounting, or financial advice. QNBFS accepts no liability whatsoever for any direct or indirect losses arising from use of this report. Any investment decision should depend on the individual circumstances of the investor and be based on specifically engaged investment advice. We therefore strongly advise potential investors to seek independent professional advice before making any investment decision. Although the information in this report has been obtained from sources that QNBFS believes to be reliable, we have not independently verified such information and it may not be accurate or complete. QNBFS does not make any representations or warranties as to the accuracy and completeness of the information it may contain, and declines any liability in that respect. For reports dealing with Technical Analysis, expressed opinions and/or recommendations may be different or contrary to the opinions/recommendations of QNBFS Fundamental Research as a result of depending solely on the historical technical data (price and volume). QNBFS reserves the right to amend the views and opinions expressed in this publication at any time. It may also express viewpoints or make investment decisions that differ significantly from, or even contradict, the views and opinions included in this report. This report may not be reproduced in whole or in part without permission from QNBFS COPYRIGHT: No part of this document may be reproduced without the explicit written permission of QNBFS. Page 6 of 6