QNBFS Weekly Market Report February 24, 2022
•
0 likes•77 views

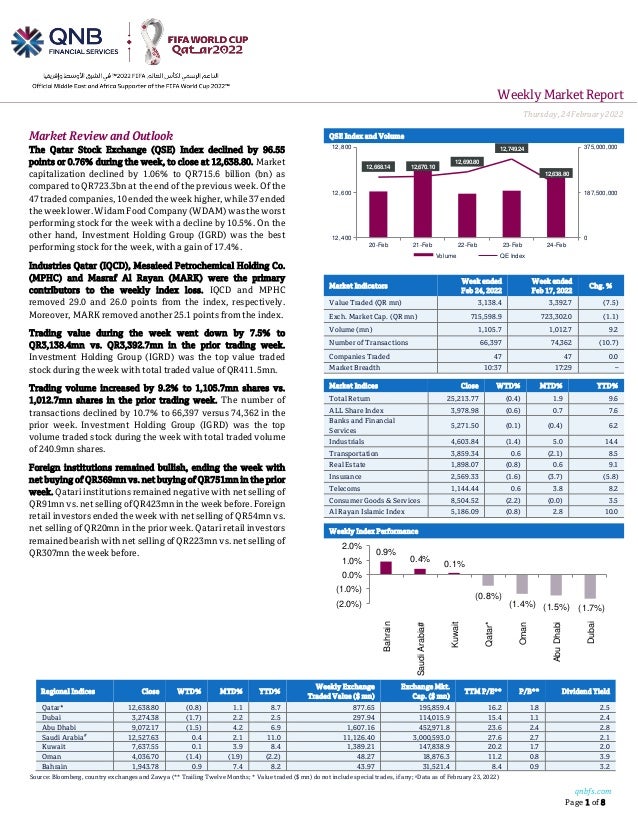
The Qatar Stock Exchange (QSE) Index declined by 96.55 points or 0.76% during the week, to close at 12,638.80

Recommended
Recommended
More Related Content
Similar to QNBFS Weekly Market Report February 24, 2022
Similar to QNBFS Weekly Market Report February 24, 2022 (20)
More from QNB Group
More from QNB Group (20)
Recently uploaded
Recently uploaded (20)
QNBFS Weekly Market Report February 24, 2022
- 1. Weekly MarketReport Thursday,24February2022 qnbfs.com Page 1 of 8 Regional Indices Close WTD% MTD% YTD% Weekly Exchange Traded Value ($ mn) Exchange Mkt. Cap. ($ mn) TTM P/E** P/B** Dividend Yield Qatar* 12,638.80 (0.8) 1.1 8.7 877.65 195,859.4 16.2 1.8 2.5 Dubai 3,274.38 (1.7) 2.2 2.5 297.94 114,015.9 15.4 1.1 2.4 Abu Dhabi 9,072.17 (1.5) 4.2 6.9 1,607.16 452,971.8 23.6 2.4 2.8 Saudi Arabia# 12,527.63 0.4 2.1 11.0 11,126.40 3,000,593.0 27.6 2.7 2.1 Kuwait 7,637.55 0.1 3.9 8.4 1,389.21 147,838.9 20.2 1.7 2.0 Oman 4,036.70 (1.4) (1.9) (2.2) 48.27 18,876.3 11.2 0.8 3.9 Bahrain 1,943.78 0.9 7.4 8.2 43.97 31,521.4 8.4 0.9 3.2 Source: Bloomberg, country exchanges and Zawya (** Trailing Twelve Months; * Value traded ($ mn) do not include special trades, if any; #Data as of February 23, 2022) Market Review and Outlook QSE Index and Volume The Qatar Stock Exchange (QSE) Index declined by 96.55 points or 0.76% during the week, to close at 12,638.80. Market capitalization declined by 1.06% to QR715.6 billion (bn) as compared to QR723.3bn at the end of the previous week. Of the 47 traded companies, 10 ended the week higher, while 37 ended theweeklower. WidamFoodCompany(WDAM)wastheworst performing stock for the week with a decline by 10.5%. On the other hand, Investment Holding Group (IGRD) was the best performing stock for the week, with a gain of 17.4%. Industries Qatar (IQCD), Mesaieed Petrochemical Holding Co. (MPHC) and Masraf Al Rayan (MARK) were the primary contributors to the weekly index loss. IQCD and MPHC removed 29.0 and 26.0 points from the index, respectively. Moreover, MARK removed another 25.1 points from the index. Trading value during the week went down by 7.5% to QR3,138.4mn vs. QR3,392.7mn in the prior trading week. Investment Holding Group (IGRD) was the top value traded stock during the week with total traded value of QR411.5mn. Trading volume increased by 9.2% to 1,105.7mn shares vs. 1,012.7mn shares in the prior trading week. The number of transactions declined by 10.7% to 66,397 versus 74,362 in the prior week. Investment Holding Group (IGRD) was the top volume traded stock during the week with total traded volume of 240.9mn shares. Foreign institutions remained bullish, ending the week with net buying of QR369mn vs. net buying of QR751mn in the prior week. Qatari institutions remained negative with net selling of QR91mnvs. netsellingofQR423mnintheweek before. Foreign retail investors ended the week with net selling of QR54mn vs. net selling of QR20mn in the prior week. Qatari retail investors remained bearish with net selling of QR223mn vs. net selling of QR307mn the week before. Market Indicators Week ended Feb 24, 2022 Week ended Feb 17, 2022 Chg. % Value Traded (QR mn) 3,138.4 3,392.7 (7.5) Exch. Market Cap. (QR mn) 715,598.9 723,302.0 (1.1) Volume (mn) 1,105.7 1,012.7 9.2 Number of Transactions 66,397 74,362 (10.7) Companies Traded 47 47 0.0 Market Breadth 10:37 17:29 – Market Indices Close WTD% MTD% YTD% Total Return 25,213.77 (0.4) 1.9 9.6 ALL Share Index 3,978.98 (0.6) 0.7 7.6 Banks and Financial Services 5,271.50 (0.1) (0.4) 6.2 Industrials 4,603.84 (1.4) 5.0 14.4 Transportation 3,859.34 0.6 (2.1) 8.5 Real Estate 1,898.07 (0.8) 0.6 9.1 Insurance 2,569.33 (1.6) (3.7) (5.8) Telecoms 1,144.44 0.6 3.8 8.2 Consumer Goods & Services 8,504.52 (2.2) (0.0) 3.5 Al Rayan Islamic Index 5,186.09 (0.8) 2.8 10.0 Weekly Index Performance 12,668.14 12,670.10 12,690.80 12,749.24 12,638.80 0 187,500,000 375,000,000 12,400 12,600 12,800 20-Feb 21-Feb 22-Feb 23-Feb 24-Feb Volume QE Index 0.9% 0.4% 0.1% (0.8%) (1.4%) (1.5%) (1.7%) (2.0%) (1.0%) 0.0% 1.0% 2.0% Bahrain Saudi Arabia# Kuwait Qatar* Oman Abu Dhabi Dubai
- 2. qnbfs.com Page 2 of 8 Economic, Market & Company News GISS' bottom line declines 69.3% QoQ in 4Q2021, below our estimate – Gulf International Services (GISS) reported net profit of QR12.9mn in 4Q2021 as compared to net loss of QR367.3mn in 4Q2020 and net profit of QR42mn in 3Q2021, below our estimate of QR59.8mn (variation of -78.4%). The company's revenue came in at QR844.4mn in 4Q2021, which represents an increase of 15.3% YoY (+3.6% QoQ). The earnings per share amounted to QR0.029 in FY2021 as compared to loss per share of QR0.171 in FY2020. The company's boards of directors decided not distribute any profit for the fiscal year 2021. Group’s revenue for the year ended 31 December 2021 amounted to QR3.1bn, with an increase of 3 percent compared to last year. Revenue growth from insurance, aviation and drilling segments was mainly offset by a negative growth in revenue from catering segment. Group reported an EBITDA of QR550mn and recorded a net profit of QR54mn for the year ended 31 December 2021. The growth in Group revenues led to an overall increase in net earnings. Moreover, an impairment provision amounting to QR308mn booked during last year, significantly impacted last year’s profitability compared to current year. Group’s finance cost declined by 21 percent to reach QR129mn, compared to QR162mn for last year, against a backdrop of lower interest rates and repayment of some loans. Similarly, general and administrative expenses declined by 7 percent on account of continued optimization initiatives. Moreover, the performance of Group’s investment portfolio was positively impacted by a recovery in capital markets, and a variance amounting to QR23m was noted on account of unrealized gains on revaluation of investment securities, when compared to last year. Group’s total assets remained relatively flat during the year and stood at QR9.9bn as at 31 December 2021, compared to last year. Cash and short-term invest-ments stood at QR698mn, up by 1 percent as compared to 31 December 2020. Total debt at Group level amounted to QR4.3bn as at 31 December 2021. Current levels of debt continue to weigh on the Group’s net earnings, as finance cost is one of the key cost ingredients, and specifically limits drilling segment’s ability to accomplish the required profitability. Revenue for Q4- 21 represented an increase of 4 percent compared to Q3-21, mainly on account of growth in revenue from aviation, catering and drilling segments, partially offset by a decline in revenue from insurance segment. Net profit for Q4-21 amounted to QR13mn with a reduction of 69 percent compared to Q3-21. This was mainly linked to a foreign currency revaluation loss from GHC’s Turkish subsidiary and impairment provisions relating to receivables within GHC. Moreover, insurance segment also witnessed a decline in net earnings during Q4-21 due to an unrealized loss reported on its investment portfolio, amid negative movements in Capital markets. Drilling segment also furthered its losses, due to higher accruals in relation to operational costs. Recovery for the Group, following constructive macroeconomic drivers along with improved oil price dynamics, remained uneven where aviation and insurance segments continued to demonstrate persistent improved set of results versus last year. Drilling segment remained under pressure until first half of the year, however, the segment started to show signs of recovery since Q3-21. The catering segment did not take advantage of macroeconomic tailwinds immediately. The sector suffered from COVID-linked restrictions and challenges that affected the hospitality industry and induced lower revenues, with higher operating costs. Nevertheless, the segment started to show signs of recovery since Q4-21. (QSE, QNBFS Research, Peninsula Qatar) SIIS' bottom line rises 316.3% QoQ in 4Q2021 – Salam International Investment Limited (SIIS) reported net profit of QR21.5mn in 4Q2021 as compared to net loss of QR62.8mn in 4Q2020 and net profit of QR5.2mn in 3Q2021. The earnings per share amounted to QR0.045 in FY2021 as compared to loss per share of QR0.128 in FY2020. The company's boards of directors decided not distribute any profit for the fiscal year 2021. (QSE) DOHI's bottom line rises 21.3% YoY and 28.7% QoQ in 4Q2021 – Doha Insurance Group's (DOHI) net profit rose 21.3% YoY (+28.7% QoQ) to QR18.5mn in 4Q2021. EPS amounted to QR0.15 in FY2021 as compared to QR0.12 in FY2020, with addition to the proposed cash dividends QR0.12. (QSE) MPHC posts 109.8% YoY increase but 20% QoQ decline in net profit in 4Q2021 – Mesaieed Petrochemical Holding Company's (MPHC) net profit rose 109.8% YoY (but declined 20% on QoQ basis) to QR423.2mn in 4Q2021.The company's share of profit from joint ventures came in at QR415.6mn in 4Q2021, which represents an increase of 48.6% YoY. However, on QoQ basis, share of profit from joint ventures fell 20.5%. EPS amounted to QR0.148 in FY2021 as compared to QR0.042 in FY2020. The Board of Directors of the company recommended a dividend of QR0.11 per share for 2021. (QSE) MCGS posts 29% YoY decrease but 15.9% QoQ increase in net profit in 4Q2021 – Medicare Group's (MCGS) net profit declined 29% YoY (but rose 15.9% on QoQ basis) to QR25.5mn in 4Q2021. EPS amounted to QR0.28 in FY2021 as compared to QR0.30 in FY2020. The Board has decided to put forward to the Ordinary General Assembly its recommendation for the distribution of cash dividends 25% of the nominal share value (i.e. QR0.25 per share). (QSE) MERS' bottom line rises 0.1% YoY and 154.3% QoQ in 4Q2021– Al Meera Consumer Goods Company's (MERS) net profit rose 0.1% YoY (+154.3% QoQ) to QR69.0mn in 4Q2021. The company's sales came in at QR689.4mn in 4Q2021, which represents a decrease of 7.0% YoY. However, on QoQ basis, sales rose 7.0%. EPS amounted to QR0.98 in FY2021 as compared to QR1.05 in FY2020. The board recommended distributing dividend of an amount of QR0.90 per share. (QSE) QFBQ reports net profit of QR38.4mn in 4Q2021 – Qatar First Bank's (QFBQ) net profit rose 3129.2% YoY (+82.6% QoQ) to QR38.4mn in 4Q2021. The earnings per share amounted to QR0.143 in FY2021 as compared to loss per share of QR0.324 in FY2020. The company's board of directors decided not distributes any profits for the fiscal year 2021. QFBQ recorded the Bank’s highest ever net profit attributable to equity holders of the bank of QR100.37mn in the previous 6 years. With a solid strategic direction under the new leadership, QFBQ overcame the difficult
- 3. qnbfs.com Page 3 of 8 market conditions followed by the challenges of the outbreak of the COVID-19 pandemic. The Bank improved its operational efficiency, developed new investment products and services, expanded its client base which led to an outstanding performance and significant growth in its financial results in 2021.The Bank maintained a sustainable fee income stream, reduced its funding costs in deposits, which resulted in a stronger balance sheet and healthy liquidity position for the year. The Bank further rationalized its operating cost by 15% over the previous year improving its operational efficiency. The Bank’s total Assets Under Management (AUM) reached QR3.85bn, an increase of 79% over the last year, following the various real estate acquisitions in the US real estate market. In 2021, QFBQ completed five new acquisitions in the United States and Qatar including LULU Messila hyper-market building, the HQ of Huntsman International, Fouteen555 a 2020-award winning multi-tenant office building, Phase 1 of Healthcare Technology Company Head-quarters, and Ten West Corporate Center One. The Bank made successful exits in its different business lines in the year 2021. In the Private Equity segment, QFBQ exited Cambridge Medical and Rehabilitation Centre Ltd, a healthcare company selling its stake for QR115mn and clocking an IRR of 19%. The Bank also exited Kennedy Flats, a multifamily residential building in the US, generating more than 9% IRR for its investors since its acquisition 3.5 years ago. The Bank invested in a fixed income portfolio to diversify its income base and improve its liquidity during 2021. Total income reached QR226.7mn for the year ending 31 December 2021 com-pared to a total loss of 42.7mn for the same period last year. The Bank increased its fee and dividend income from QR19mn to QR44mn registering a growth of 131%, mainly driven by QFBQ’s focus on real estate investments and Sukuk funds. Total equity attributable to QFBQ’s shareholders reached QR573mn at the end of 2021, while the capital adequacy under Basel III reached 18% at the end of the year, which affirms QFBQ’s strong financial position. In addition, QFBQ’s client base increased by more than 100% which reflects the Bank’s successful strategy and the clients’ confidence in its products and services. The Bank’s asset portfolio, profitability growth and increase in client base reflects its continuous efforts in improving the quality in various business parameters. (QSE, Peninsula Qatar) AHCS' bottom line rises 208.2% YoY and 25.9% QoQ in 4Q2021 – Aamal Company's (AHCS) net profit attributable to equity holders of the parent rose 208.2% YoY (+25.9% QoQ) to QR97.8mn in 4Q2021.The company's revenue came in at QR493.6mn in 4Q2021, which represents an increase of 47.4% YoY (+26.6% QoQ). EPS amounted to QR0.05 in FY2021 as compared to QR0.02 in FY2020, with distribution of cash dividends of QR0.05 per share. Aamal Company has reported a 156.3% year-on-year growth in net profit to QR312mn in 2021. Total revenue shot up 22% to QR1.59bn, mainly on the back of the industrial manufacturing, property and managed services. "Underpinned by Aamal’s clear strategy, sustained financial strength, disciplined cost control, and resilient and diversified business model, all four business segments performed well at an operational level and demonstrated the company’s ongoing ability to seize new opportunities as they arise and to adapt swiftly to evolving market demands," said Aamal Chairman HE Sheikh Faisal bin Qassim al-Thani. The industrial manufacturing revenue rose 113% year-on-year to QR431.7mn and net profit by 74.7% to QR56.6mn, reflecting its success in launching new products, expanding production capacity, and further developing its client base.Highlighting that the outlook of the segment for 2022 remains “positive”, Aamal said the Qatari government has allocated QR74bn for major projects in 2022, benefiting several of the segment's subsidiaries, including Aamal Readymix which has a strong project pipeline for this year. Furthermore, there is an imperative to accelerate the completion of existing construction projects ahead of the FIFA World Cup. The property segment revenue increased 38.8% year-on-year to QR262.6mn and net profit by 945.9% to QR197.6mn, reflecting new shop openings at City Center Doha, improved occupancy rates at Aamal Real Estate, and the elimination of negative fair value adjustments made in 2020 at the height of the pandemic restrictions (QSE, Gulf-Times.com) WDAM reports net loss of QR41.7mn in 4Q2021 – Widam Food Company (WDAM) reported net loss of QR41.7mn in 4Q2021 as compared to net loss of QR13.8mn in 4Q2020 and QR9mn in 3Q2021. Loss per share amounted to QR0.37 in FY2021 as compared to earnings per share of QR0.28 in FY2020. The company's board of directors decided not distributes any profits for the fiscal year 2021. (QSE) QInvest posts QR204mn revenues for FY 2021 – QInvest, Qatar’s leading investment bank and one of the most prominent Islamic financial institutions globally, yesterday announced its financial results for the fiscal year 2021 (FY2021). The Bank has reported growth in its revenue figures, including QR204mn revenues from all business lines and an operating profit of QR84mn. Sheikh Jassim bin Hamad bin Jassim bin Jaber Al Thani, Chairman of QInvest said: “Global markets have continued to evolve during the unprecedented economic disruption and market volatility brought on by the COVID-19 pandemic. It is testament to the resilience of QInvest, our business, and the adaptability of our strategy, that we not only weathered this challenging macroeconomic environment but emerged in a stronger position. The company’s latest results demonstrate the success of QInvest’s long-term strategy, which aims to deliver consistent value to our shareholders”. Hussain Abdulla, Co-Chief Executive Officer of QInvest said: “QInvest’s performance over 2021 reasserts the company’s ability to deliver resilient returns despite financial headwinds across the region and the world. Having repositioned the business to focus on maximising the value of our shareholder’s equity and pro-viding them with consistent, long-term returns. The company successfully captured new and diversified mandates, made several strategic investments and solidified relation-ships with existing clients, crucial factors that will support the Bank’s performance in 2022 and beyond”. The past year saw QInvest reinvest in more liquid asset portfolios directly or via funds, and mid-level risk real estate investments where the business has a strong and consistent track record of delivering robust returns with a plan to recycle its long dated assets. (Peninsula Qatar) Qatar to raise LNG production to 126 MTPA by 2027 – Amir HH Sheikh Tamim bin Hamad Al Thani said yesterday that Qatar is working to develop and increase its production capacity of Liquefied Natural Gas (LNG) from 77 million tonnes per annum (MTPA) currently to 126 million tonnes per year by 2027 through
- 4. qnbfs.com Page 4 of 8 the North Field production expansion projects. Addressing the opening of the 6th Summit of the Gas Exporting Countries Forum (GECF), HH the Amir said the North Field production expansion projects include huge investments in eco-friendly technologies, namely an integrated system for capturing and injecting carbon dioxide, which, when fully operational, will become the largest of its kind in the LNG industry. Solar energy will be relied upon to generate part of the electricity required for this project. HH the Amir patronised the opening of the 6th Summit GECF, which was held yesterday under the title ‘Natural Gas: Shaping the Energy Future’, at Sheraton Grand Doha Hotel. (Peninsula Qatar) Qatar Investment Authority to buy minority interest in AIT – Qatar Investment Authority agrees to acquire a minority interest in U.S.-based Advanced Integration Technology, a provider of factory automation to the aerospace, defense, and space launch sectors. Transaction expected to close in 2022. The Qatari wealth will acquire the interest via a combination of primary capital, partial sales by AIT’s two shareholders: AIT’s founding management team and Onex Partners IV. Following the transaction, the three parties will assume minority joint ownership of the company. (Bloomberg) More than 93 percent of QNB Group’s customers use digital channels – QNB Group has witnessed high adoption of its digital channels by the customers helped by bank’s focus on digital innovation and customer-centric approach. Over 93 percent of QNB’s customers in Qatar are using its digital channels. “This year, our focus in Qatar was on enhancing our omnichannel distribution mix, boosting self-service capacity, reducing the load on our physical network and upgrading the Bank’s ecosystem. As a result, more than 93 percent of our customers in Qatar use our digital channels,” noted QNB’s ‘Annual Report 2021’. QNB witnessed powerful momentum in the cards market across 2021. This was driven by a surge in card acceptance, a substantial increase in e-commerce activity - including the successful launch of Apple Pay in Qatar - and the success of its digital enhancements and partnerships. (Peninsula Qatar) Office space demand likely to recover this year – The office space supply has increased significantly in the last quarter of 2021. With the entry of new companies in thelocal market, the demand for office space is expected to recover in the current year. Public sector entities, financial institutions and companies in oil and gas sector are driving the demand for new office spaces. “Office supply in Qatar has increased significantly in recent months, with the opening of Qatar Energy’s new head-quarters at Abdullah Bin Hamad Al Attiyah District and Lusail’s Commercial Boulevard adding more than 300,000 sq m of space between the two developments,” noted the Q4 Real Estate Market Review report released by Cushman & Wakefield. (Peninsula Qatar) Qatar’s pandemic strategy to ensure safe 2022 World Cup – Qatar’s comprehensive strategy to control the spread of COVID- 19 plays a crucial role as the country is preparing to receive ahigh number of visitors during the FIFA World Cup in 2022.The country’s ability to predict periods of high trans-mission, use of methods to improve contact tracing and sharing of information, and implementation of a broad testing strategy to reduce the risk of transmission are imperative. This will be effective not only in the current situation but in the long term as the country will witness a substantial increase in the number of visitors during the FIFA World Cup Qatar 2022 and protect its citizens and residents, said a report published on Qatar’s Medical Journal, recently. (Peninsula Qatar) Brent Oil Jumps to $100 a Barrel on Russia-Ukraine Tensions - Brent oil surged past $100 a barrel for the first time since 2014 as Russia’s dramatic escalation of the Ukraine crisis sparked fears of a disruption to the region’s critical energy exports. Futures in London jumped as much as 3.3% after a report that President Vladimir Putin has decided to conduct a military operation. Russia is a key supplier of energy to global customers, with Europe relying on the nation for about a quarter of its oil supplies and a third of its gas. Crude’s return to triple digits completes a prodigious recovery -- barely imaginable a year ago -- as the market flips from surplus to scarcity. It reflects a global economy rushing back to normality from Covid-19 faster than it can secure supplies of raw materials of all kinds. In addition to oil and gas, Russia is a major producer of aluminum and wheat, which Ukraine also grows. The increase in the price of multiple commodities is contributing to a surge in inflation to the highest level in decades, threatening a cost-of-living crisis for millions and forcing central banks to contemplate a phase of monetary tightening that might choke off the rebound. It even extends beyond oil, across the full spectrum of energy derivatives and commodities markets. More raw materials are commanding a premium for prompt deliveries -- a condition known as backwardation -- than at any point in the past two decades, according to Bloomberg calculations. This creates a profound dilemma for Western powers. (Bloomberg)
- 5. qnbfs.com Page 5 of 8 Qatar Stock Exchange Top Gainers Top Decliners Source: Qatar Stock Exchange (QSE) Source: Qatar Stock Exchange (QSE) Most Active Shares by Value (QR Million) Most Active Shares by Volume (Million) Source: Qatar Stock Exchange (QSE) Source: Qatar Stock Exchange (QSE) Investor Trading Percentage to Total Value Traded Net Traded Value by Nationality (QR Million) Source: Qatar Stock Exchange (QSE) Source: Qatar Stock Exchange (QSE) 17.4% 6.8% 3.1% 2.6% 2.3% 0.0% 7.0% 14.0% 21.0% Investment Holding Group Doha Insurance Group Ooredoo Qatar General Insurance & Reinsurance Company Qatar Gas Transport Company Limited -10.5% -8.4% -7.8% -5.7% -5.0% -12.0% -8.0% -4.0% 0.0% Widam Food Company Medicare Group Mannai Corporation Qatar Oman Investment Company Vodafone Qatar 411.5 381.2 340.0 260.8 206.5 0.0 150.0 300.0 450.0 Investment Holding Group QNB Group Industries Qatar Qatar Islamic Bank Salam International Investment Limited 240.9 218.7 111.1 55.2 55.1 0.0 100.0 200.0 300.0 Investment Holding Group Salam International Investment Limited Gulf International Services Qatar Aluminium Manufacturing Company Mazaya Qatar Real Estate Development 0% 20% 40% 60% 80% 100% Buy Sell 41.19% 48.30% 18.53% 21.44% 13.07% 14.80% 27.21% 15.46% Qatari Individuals Qatari Institutions Non-Qatari Individuals Non-Qatari Institutions 1,874 1,264 2,189 950 -314 314 -500 0 500 1,000 1,500 2,000 2,500 Qatari Non-Qatari Net Investment Total Sold Total Bought
- 6. qnbfs.com Page 6 of 8 TECHNICAL ANALYSIS OF THE QSE INDEX Source: Bloomberg The QE Index stayed with momentum, but closed marginally lower by 0.8% from the previous week. The Index printed last 12,638.80. The possibility for a correction (as we predicted from previous week’s report) is increasing, as we see candlestick formation suggesting the indecision of the current market participants. Our resistance level remains at 13,000 points; our support level at 12,000 points. DEFINITIONS OF KEY TERMS USED IN TECHNICAL ANALYSIS RSI (Relative Strength Index) indicator – RSI is a momentum oscillator that measures the speedand change of price movements. The RSI oscillates between 0 to 100. The index is deemed to be overbought once the RSI approaches the 70 level, indicating that a correction is likely. On the other hand, if the RSI approaches 30, it is an indication that the index may be getting oversold and therefore likely to bounce back. MACD (Moving Average Convergence Divergence) indicator – The indicator consists of the MACD line and a signal line. The divergence or the convergence of the MACD line with the signal line indicates the strength in the momentum during the uptrend or downtrend, as the case may be. When the MACD crosses the signal line from below and trades above it, it gives a positive indication. The reverse is the situation for a bearish trend. Candlestick chart – A candlestick chart is a price chart that displays the high, low, open, and close for a security. The ‘body’ of the chart is portion between the open and close price, while the high and low intraday movements form the ‘shadow’. The candlestick may represent any time frame. We use a one-day candlestick chart (every candlestick represents one trading day) in our analysis. Doji candlestick pattern – A Doji candlestick is formed when a security's open and close are practically equal. The pattern indicates indecisiveness, and based on preceding price actions and future confirmation, may indicate a bullish or bearish trend reversal. ShootingStar/Inverted Hammer candlestick patterns – These candlestick patterns have a small real body (open price and close price are near to each other), and a long upper shadow (large intraday movement on the upside). The Shooting Star is a bearish reversal pattern that forms after a rally. The Inverted Hammer looks exactly like a Shooting Star, but forms after a downtrend. Inverted Hammers represent a potential bullish trend reversal.
- 7. qnbfs.com Page 7 of 8 Source: Bloomberg Com pan y Nam e P rice Fe bruary 24 % Ch an ge WTD % Ch an ge YTD Marke t Cap. QR Million TTM P /E P /B Div. Yie ld Qatar National Bank 20.80 (0.24) 3.02 192,118 15.7 2.4 2.6 Qatar Islamic Bank 20.70 1.02 12.93 48,913 14.5 2.4 2.8 Commercial Bank of Qatar 6.70 (1.73) (0.77) 27,104 13.2 1.5 1.5 Doha Bank 2.74 (2.18) (14.38) 8,495 11.9 0.8 2.7 Al Ahli Bank 4.40 (0.02) 14.86 10,688 15.0 1.6 3.4 Qatar International Islamic Bank 10.25 (2.66) 11.29 15,515 17.2 2.3 3.2 Masraf Al Rayan 4.87 (1.70) 4.98 45,300 21.8 1.9 3.5 Qatar First Bank 1.77 (1.45) (1.12) 1,239 8.4 2.2 N/A National Leasing 0.87 (3.88) (7.87) 428 N/A 0.6 N/A Dlala Holding 1.42 (1.39) 15.07 404 26.1 1.8 N/A Qatar & Oman Investment 0.81 (5.70) (0.37) 255 45.2 0.9 N/A Islamic Holding Group 4.85 (3.00) 22.94 275 45.0 1.9 1.0 Ban kin g an d Fin an cial Se rvice s 350,735 Zad Holding 16.40 0.61 (1.80) 4,275 22.1 2.9 3.9 Qatar German Co. for Medical Devices 2.56 (4.31) (19.65) 295 96.8 8.9 N/A Salam International Investment 0.92 (3.16) 12.33 1,052 19.9 0.7 N/A Baladna 1.43 (4.35) (1.04) 2,718 N/A 1.2 3.7 Medicare Group 7.69 (8.40) (9.46) 2,165 27.1 2.1 23.4 Qatar Cinema & Film Distribution 3.68 (0.14) 3.52 231 75.1 1.7 2.7 Qatar Fuel 19.55 (1.26) 6.95 19,438 20.1 2.2 2.4 Qatar Meat and Livestock 3.09 (10.48) (13.97) 557 8.2 1.8 3.2 Mannai Corp. 7.70 (7.77) 62.17 3,513 8.7 1.6 0.1 Al Meera Consumer Goods 19.82 (2.12) 1.12 3,964 20.1 2.6 4.5 Con sum e r Goods an d Se rvice s 38,208 Qatar Industrial Manufacturing 3.20 (0.34) 4.17 1,520 11.1 0.9 3.1 Qatar National Cement 6.28 (1.84) 23.18 4,105 18.2 1.3 3.2 Industries Qatar 17.70 (1.45) 14.27 107,085 13.3 2.7 1.9 Qatari Investors Group 2.16 (4.67) (2.61) 2,688 19.6 0.9 2.8 Qatar Electricity and Water 17.95 (0.22) 8.13 19,745 13.3 1.7 3.5 Aamal 1.17 (0.68) 7.84 7,365 24.0 0.9 3.4 Gulf International Services 1.73 (3.30) 0.82 3,215 59.4 1.0 N/A Mesaieed Petrochemical Holding 2.62 (5.01) 25.22 32,878 17.7 1.9 1.5 Invesment Holding Group 1.79 17.42 45.32 1,482 74.6 1.7 N/A Qatar Aluminum Manufacturing 2.09 0.63 16.21 11,679 14.0 1.8 1.7 In dustrials 191,762 Qatar Insurance 2.44 (3.60) (11.31) 7,966 15.0 0.9 N/A QLM Life & Medical Insurance 5.10 0.18 0.99 1,785 16.9 3.0 N/A Doha Insurance 2.03 6.79 5.73 1,015 13.8 0.9 4.9 Qatar General Insurance & Reinsurance 2.00 2.56 0.00 1,750 13.6 0.3 N/A Al Khaleej Takaful Insurance 3.68 (3.26) 2.11 938 19.3 1.8 1.4 Qatar Islamic Insurance 8.65 (0.77) 8.13 1,298 16.0 3.2 3.8 In suran ce 14,752 United Development 1.65 (1.20) 7.14 5,842 16.4 0.5 3.0 Barwa Real Estate 3.54 0.94 15.52 13,756 12.3 0.7 3.5 Ezdan Real Estate 1.34 (4.57) (0.37) 35,437 92.1 1.1 N/A Mazaya Qatar Real Estate Development 0.87 (4.19) (5.54) 1,006 32.8 0.8 3.5 Re al Estate 56,041 Ooredoo 7.79 3.11 10.97 24,953 661.9 1.2 3.2 Vodafone Qatar 1.70 (5.03) 1.98 7,186 21.8 1.6 2.9 Te le com s 32,139 Qatar Navigation (Milaha) 8.38 (1.09) 9.70 9,520 13.2 0.6 3.6 Gulf Warehousing 4.36 (4.68) (4.03) 255 11.4 1.2 2.3 Qatar Gas Transport (Nakilat) 3.59 2.28 8.79 19,890 14.6 2.3 3.1 Tran sportation 29,665 Qatar Exch an ge 715,599
- 8. qnbfs.com Contacts QNB Financial Services Co. W.L.L. Contact Center: (+974) 4476 6666 info@qnbfs.com.qa Doha, Qatar Saugata Sarkar, CFA, CAIA Head of Research saugata.sarkar@qnbfs.com.qa Shahan Keushgerian Senior Research Analyst shahan.keushgerian@qnbfs.com.qa . Disclaimer and Copyright Notice: This publication has been prepared by QNB Financial Services Co. W.L.L. (“QNBFS”) a wholly-owned subsidiary of Qatar National Bank (Q.P.S.C.). QNB FS is regulated by the Qatar Financial Markets Authority and the Qatar Exchange. Qatar National Bank (Q.P.S.C.) is regulated by the Qatar Central Bank. This publication expresses the views and opinions of QNBFS at a given time only. It is not an offer, promotion or recommendation to buy or sell securities or other investments, nor is it intended to constitute legal, tax, accounting, or financial advice. QNBFS accepts no liability whatsoever for any direct or indirect losses arising from use of this report. Any investment decision should depend on the individual circumstances of the investor and be based on specifically engaged investment advice. We therefore strongly advise potential investors to seek independent professional advice before making any investment decision. Although the information in this report has been obtained from sources that QNBFS believes to be reliable, we have not independently verified such information and it may not be accurate or complete. QNBFS does not make any representations or warranties as to the accuracy and completeness of the information it may contain, and declines any liability in that respect. For reports dealing with Technical Analysis, expressed opinions and/or recommendations may be different or contrary to the opinions/recommendations of QNBFS Fundamental Research as a result of depending solely on the historical technical data (price and volume). QNBFS reserves the right to amend the views and opinions expressed in this publication at any time. It may also express viewpoints or make investment decisions that differ significantly from, or even contradict, the views and opinions included in this report. This report may not be reproduced in whole or in part without permission from QNBFS. COPYRIGHT: No part of this document may be reproduced without the explicit written permission of QNBFS. Page 8 of 8