Lundin Gold April 2024 Corporate Presentation v4.pdf
Weekly market report
1. Page 1 of 5
Market Review and Outlook QE Index and Volume
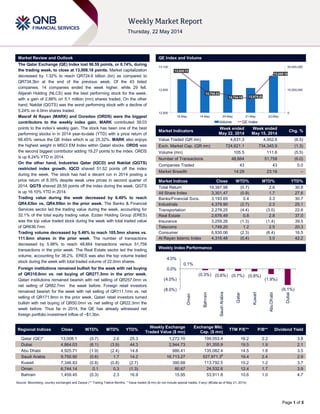
The Qatar Exchange (QE) Index lost 96.59 points, or 0.74%, during
the trading week, to close at 13,008.16 points. Market capitalization
decreased by 1.32% to reach QR724.6 billion (bn) as compared to
QR734.3bn at the end of the previous week. Of the 43 listed
companies, 14 companies ended the week higher, while 29 fell.
Alijarah Holding (NLCS) was the best performing stock for the week,
with a gain of 2.88% on 5.1 million (mn) shares traded. On the other
hand, Nakilat (QGTS) was the worst performing stock with a decline of
5.24% on 4.0mn shares traded.
Masraf Al Rayan (MARK) and Ooredoo (ORDS) were the biggest
contributors to the weekly index gain. MARK contributed 39.03
points to the index’s weekly gain. The stock has been one of the best
performing stocks in in 2014 year-to-date (YTD) with a price return of
66.45% versus the QE Index which is up 25.32%. MARK also enjoys
the highest weight in MSCI EM Index within Qatari stocks. ORDS was
the second biggest contributor adding 19.27 points to the index. ORDS
is up 8.24% YTD in 2014.
On the other hand, Industries Qatar (IQCD) and Nakilat (QGTS)
restricted index growth. IQCD shaved 51.52 points off the index
during the week. The stock has had a decent run in 2014 posting a
price return of 8.35% despite weak urea prices in second quarter of
2014. QGTS shaved 28.55 points off the index during the week. QGTS
is up 16.10% YTD in 2014.
Trading value during the week decreased by 6.49% to reach
QR4.63bn vs. QR4.95bn in the prior week. The Banks & Financial
Services sector led the trading value during the week, accounting for
32.1% of the total equity trading value. Ezdan Holding Group (ERES)
was the top value traded stock during the week with total traded value
of QR636.7mn.
Trading volume decreased by 5.46% to reach 105.5mn shares vs.
111.6mn shares in the prior week. The number of transactions
decreased by 5.98% to reach 48,664 transactions versus 51,758
transactions in the prior week. The Real Estate sector led the trading
volume, accounting for 38.2%. ERES was also the top volume traded
stock during the week with total traded volume of 22.0mn shares.
Foreign institutions remained bullish for the week with net buying
of QR318.6mn vs. net buying of QR277.3mn in the prior week.
Qatari institutions remained bearish with net selling of QR257.0mn vs
net selling of QR82.7mn the week before. Foreign retail investors
remained bearish for the week with net selling of QR111.1mn vs. net
selling of QR171.9mn in the prior week. Qatari retail investors turned
bullish with net buying of QR50.0mn vs. net selling of QR22.3mn the
week before. Thus far in 2014, the QE has already witnessed net
foreign portfolio investment inflow of ~$1.3bn.
Market Indicators
Week ended
May 22, 2014
Week ended
May 15, 2014
Chg. %
Value Traded (QR mn) 4,631.3 4,952.6 (6.5)
Exch. Market Cap. (QR mn) 724,621.1 734,345.9 (1.3)
Volume (mn) 105.5 111.6 (5.5)
Number of Transactions 48,664 51,758 (6.0)
Companies Traded 43 43 0.0
Market Breadth 14:29 23:18 –
Market Indices Close WTD% MTD% YTD%
Total Return 19,397.98 (0.7) 2.6 30.8
All Share Index 3,301.47 (0.9) 1.7 27.6
Banks/Financial Svcs. 3,193.65 0.4 3.3 30.7
Industrials 4,379.90 (2.7) 2.3 25.1
Transportation 2,278.25 (4.4) (3.0) 22.6
Real Estate 2,676.49 0.8 2.8 37.0
Insurance 3,259.26 (1.3) (1.4) 39.5
Telecoms 1,749.20 1.2 2.5 20.3
Consumer 6,930.06 (2.3) (6.4) 16.5
Al Rayan Islamic Index 4,316.48 (0.4) 3.0 42.2
Market Indices
Weekly Index Performance
Regional Indices Close WTD% MTD% YTD%
Weekly Exchange
Traded Value ($ mn)
Exchange Mkt.
Cap. ($ mn)
TTM P/E** P/B** Dividend Yield
Qatar (QE)* 13,008.1
6
(0.7) 2.6 25.3 1,272.10 199,053.4 16.2 2.2 3.8
Dubai 4,864.03 (6.1) (3.9) 44.3 2,944.73 91,355.9 19.5 1.9 2.1
Abu Dhabi 4,925.71 (1.9) (2.4) 14.8 886.41 135,082.4 14.5 1.8 3.5
Saudi Arabia 9,750.90 (0.6) 1.7 14.2 16,713.27 527,971.3#
19.4 2.4 2.9
Kuwait 7,346.83 (0.8) (0.8) (2.7) 390.68 113,792.5 15.2 1.2 3.7
Oman 6,744.14 0.1 0.3 (1.3) 80.67 24,532.6 12.4 1.7 3.9
Bahrain 1,459.45 (0.3) 2.3 16.9 15.95 53,911.8 10.6 1.0 4.7
Source: Bloomberg, country exchanges and Zawya (** Trailing Twelve Months; * Value traded ($ mn) do not include special trades, if any) (#Data as of May 21, 2014)
13,020.72
12,788.23
12,734.15 12,679.53
13,008.16
0
15,000,000
30,000,000
12,500
12,800
13,100
18-May 19-May 20-May 21-May 22-May
Volume QE Index
0.1%
(0.3%) (0.6%) (0.7%) (0.8%)
(1.9%)
(6.1%)(8.0%)
(4.0%)
0.0%
4.0%
Oman
Bahrain
SaudiArabia
Qatar
Kuwait
AbuDhabi
Dubai
2. Page 2 of 5
News
Economic News
Deposit and loans both grew by 0.6% MoM in the month of
April 2014 – After posting a flat performance (down 0.1%
month-over-month [MoM] in March 2014), loans grew by 0.6%
MoM in April 2014 primarily due to pick-up in credit off-take
from the private sector which posted a growth of 2.2% MoM. On
the other hand, deposits continued with its gradual growth
(+0.6% MoM) and are up 6.5% year-to-date (YTD) vs. 3.8%
growth in the loan book. Hence, the banking sector’s loans-to-
deposits ratio (LDR) stood at 103% at the end of April 2014 vs.
105% at the end of 2013. On the loan book front, total domestic
public sector loans declined by 1.3% MoM but are still up 1.4%
YTD. The government segment’s loan book declined by 0.3%
MoM after a 5.5% MoM growth in March 2014 (+18.6% YTD
2014). Furthermore, government institutions’ segment
(represents ~60% of public sector loans) declined by 2.3%
MoM and is still down 3.7% YTD. Private sector loans grew by
2.2% MoM and are up 5.0% YTD. The Contractors segment
posted a 0.7% decline MoM. Despite this, contractors remain
the best performing segment in the private sector, posting a
growth 12.7% in the first four months of 2014. The General
Trade segment (contributes ~13% to private sector loans) loan
book grew by 1.1% MoM (+11.2% YTD). However, two other
segments, real estate and consumption & others have posted
modest growth in the first four months of 2014. Consumption &
Others (contributes ~29% to private sector loans) increased by
1.2% MoM (+3.5 YTD). Real Estate (contributes ~28% to
private sector loans) inched up by 0.7%. (QCB, QNBFS)
Market & Corporate News
GDI places its third rig into service for Oxy Qatar –
Occidental Petroleum of Qatar (Oxy Qatar) has accepted the
jack-up drilling rig ‘Msheireb’, which was acquired by Gulf
Drilling International (GDI) earlier this year and refurbished for
drilling operations that are set to commence this week. This
was jointly announced by GDI, and Oxy Qatar in Doha.
Msheireb will be the third GDI rig to be placed in service for Oxy
Qatar with other two rigs ‘Al Rayyan’ and ‘Al Wajba’ already
under contract. Msheireb has a 60ft cantilever outreach with
capability to drill to a depth of 25,000ft, operate in a water depth
of 300ft, and accommodate 116 persons on board. (Gulf-
Times.com)
Moody's affirms Qatar International Islamic Bank ratings;
changed outlook to positive from stable – Moody's Investors
Service has today affirmed Qatar International Islamic Bank
(Q.S.C.)'s (QIIK) A3 global long term issuer ratings, Prime-2
short term issuer ratings and D+ standalone bank financial
strength rating (BFSR), which is equivalent to a ba1 baseline
credit assessment (BCA). At the same time, Moody's changed
the outlook on the bank's long-term ratings to positive from
stable. (Moody’s)
Doha Bank to raise capital in 2015 – Doha Bank plans to
raise additional capital in 2015 to underpin fast asset growth
and potential acquisitions, the group chief executive of Qatar’s
fourth-largest bank by assets said yesterday. The bank is
looking at several options to raise capital, such as a rights
issue, R. Seetharaman told reporters at a news conference in
Kuwait. “If our organic expansion is per the growth model we
envisage, then we will need additional capital, which we will
mobilize next year,” he said. (Gulf-times.com)
DHBK sees enhanced potential in Kuwait – Doha Bank’s
(DHBK) Group CEO, Dr. R. Seetharaman said building the
bank’s partnerships in Kuwait is one of the top priorities in the
current fiscal year. Dr. Seetharaman said Kuwait enjoys strong
bilateral trade partnerships with countries such as the US, the
UK, India, Japan, South Korea and China. Kuwaiti companies
are also seeking to establish strong partnerships or to grow
organically in these markets, and DHBK is keen to support their
ambitions through its global representative network. In addition
to full branches in Qatar, Kuwait, and the UAE, DHBK has
representative offices in Canada, the UK, Germany, Turkey,
South Korea, China, Hong Kong, Singapore, Japan, and
Australia. (AmeInfo.com)
VFQS’ March 31, 2014 customer base reaches 1,327,000,
which is right in line with our estimate – Vodafone Qatar
(VFQS) continues to expand its mobile customer base in Qatar,
growing its number of customers by 22% YoY to reach
1,327,000 customers as at March 31, 2014. VFQS’ CEO Kyle
Whitehill said that 62% of Qatar’s population is using VFQS’
services every month, which is a great achievement for the
company’s shareholders, staff and partners. Reported mobile
subscriber base came in around 1% below our estimate of
1,340,149. VFQS reports FY2014 results after its board
meeting on May 27, 2014 and we continue to expect improving
financial metrics. We are projecting QR543mn in revenue for
4QFY2014 (+7% QoQ, +25% YoY). We model net loss to
decline to QR50mn versus QR53mn and QR74mn in December
2013 and March 2013 quarters, respectively. Finally, we
continue to expect VFQS to pay QR0.10 in DPS for FY2014.
We rate VFQS an Underperform with a price target of QR13.95.
(VFQS Press release, QNBFS Research)
KCBK’s Group CEO resigns; BoD to meet on June 3 – Al
Khalij Commercial Bank’s (KCBK) Group CEO Robin McCall
has resigned from his duties citing personal reasons. The
company’s board of directors has accepted his resignation.
However, McCall will continue to work as the CEO until a
suitable replacement is appointed. Meanwhile, KCBK’s BoD will
meet on June 3, 2014 to discuss and approve various
business-related items. We recommend a Market Perform
rating on the stocks with a 12-month target price of QR23.41.
(QE, QNBFS Research)
BRES appoints acting CEO – Barwa Real Estate Company
(BRES) has appointed Ahmad Abdulla Ali Al Abdulla as the
acting CEO for the group, effective from May 19, 2014,
following the resignation of the former Group CEO Abdulla Al
Subaie. Ahmad Al Abdulla had previously served as BRES’
Deputy Group CEO. (QE
Moody's withdraws QAFCO's ratings for its own business
reasons – Moody's Investors Service, (Moody's) has withdrawn
its Aa3 issuer rating for Qatar Fertiliser Company (QAFCO) for
its own business reasons. Our conversation with Moody’s
indicated that there were no QAFCO-specific negative factors
behind the ratings withdrawal. (Bloomberg, QNBFS Research)
Karwa taxi service to be privatized – The Karwa taxi service
in Qatar will be fully privatized by 2017 with six private
companies expected to run the service. Mowasalat, the state
transport company, will remain the regulator for private taxi
operators. Karwa has awarded contracts to four private taxi
companies and two of them are already operating their
services. The contracts awarded would be for a period of five
years and would be renewable. Plans are afoot to increase the
number of private taxi operators to six, with Mowasalat not
operating any taxis and just functioning as the regulator.
(Peninsula Qatar)
3. Page 3 of 5
Qatar Exchange
Top 5 Gainers Top 5 Decliners
Source: Qatar Exchange (QE) Source: Qatar Exchange (QE)
Most Active Shares by Value (QR Million) Most Active Shares by Volume (Million)
Source: Qatar Exchange (QE) Source: Qatar Exchange (QE)
Investor Trading Percentage to Total Value Traded Net Traded Value by Nationality (QR Million)
Source: Qatar Exchange (QE) Source: Qatar Exchange (QE)
2.9%
2.7%
2.6%
2.1%
1.8%
0.0%
1.5%
3.0%
4.5%
National
Leasing
Islamic Holding
Group
Masraf Al
Rayan
Ooredoo Qatar German
Co. for Medical
Devices
-5.2%
-4.7%
-3.9%
-3.5% -3.4%
-6.0%
-4.0%
-2.0%
0.0%
Qatar Gas
Transport
(Nakilat)
Mesaieed
Petrochemical
Holding
Company
Milaha Qatar Fuel Ezdan Real
Estate
636.7
466.3
365.7
312.0
258.9
0.0
250.0
500.0
750.0
Ezdan Real
Estate
Masraf Al
Rayan
Industries
Qatar
QNB Group United
Development
22.0
13.9
10.1
9.2
5.8
0.0
10.0
20.0
30.0
Ezdan Real
Estate
Vodafone Qatar United
Development
Masraf Al Rayan Barwa Real
Estate
0%
20%
40%
60%
80%
100%
Buy Sell
41.60% 40.52%
13.14% 18.69%
13.67%
16.07%
31.59%
24.71%
Qatari Individuals Qatari Institutions
Non-Qatari Individuals Non-Qatari Institutions
2,535
2,096
2,742
1,889
(207)
207
(500) - 500 1,000 1,500 2,000 2,500 3,000
Qatari
Non-Qatari
Net Investment Total Sold Total Bought
4. Page 4 of 5
TECHNICAL ANALYSIS OF THE QE INDEX
Source: Bloomberg
The QE Index ended last week in the red zone declining by around 97 points. The index slipped below the 13,000.0 level on Monday and subsequently
threatened to penetrate its important support near 12,680.0 on Wednesday, indicating a deeper correction. However, the index successfully defended its
support near 12,680.0 and rebounded reclaiming the 12,770.0, 12,940.0 and 13,000.0 levels along with the 21-day moving average. The index registered
an impressive rally gaining around 329 points on Thursday, trimming majority of its losses. This was a nice display of strength by the bulls, which helped in
keeping its short-term and long-term uptrend intact. Going forward, traders should keep a close watch on the 12,940.0 level for any reversal signs as a
retreat below this level may drag the index to retest 12,770.0. Meanwhile, the index has support for a higher move from the RSI, which has shown a bullish
divergence, while the MACD is showing signs of recovery. We believe the index may continue to scale higher if it manages to hold onto the 12,940.0 level.
Thus, traders may adopt a bullish approach but must follow strict stop losses as volatility is likely to continue.
DEFINITIONS OF KEY TERMS USED IN TECHNICAL ANALYSIS
RSI (Relative Strength Index) indicator – RSI is a momentum oscillator that measures the speed and change of price movements. The RSI oscillates
between 0 to 100. The index is deemed to be overbought once the RSI approaches the 70 level, indicating that a correction is likely. On the other hand, if
the RSI approaches 30, it is an indication that the index may be getting oversold and therefore likely to bounce back.
MACD (Moving Average Convergence Divergence) indicator – The indicator consists of the MACD line and a signal line. The divergence or the
convergence of the MACD line with the signal line indicates the strength in the momentum during the uptrend or downtrend, as the case may be. When the
MACD crosses the signal line from below and trades above it, it gives a positive indication. The reverse is the situation for a bearish trend.
Candlestick chart – A candlestick chart is a price chart that displays the high, low, open, and close for a security. The ‘body’ of the chart is portion between
the open and close price, while the high and low intraday movements form the ‘shadow’. The candlestick may represent any time frame. We use a one-day
candlestick chart (every candlestick represents one trading day) in our analysis.
Doji candlestick pattern – A Doji candlestick is formed when a security's open and close are practically equal. The pattern indicates indecisiveness, and
based on preceding price actions and future confirmation, may indicate a bullish or bearish trend reversal.
Shooting Star/Inverted Hammer candlestick patterns – These candlestick patterns have a small real body (open price and close price are near to each
other), and a long upper shadow (large intraday movement on the upside). The Shooting Star is a bearish reversal pattern that forms after a rally. The
Inverted Hammer looks exactly like a Shooting Star, but forms after a downtrend. Inverted Hammers represent a potential bullish trend reversal.
5. Contacts
Saugata Sarkar Keith Whitney Sahbi Kasraoui
Head of Research Head of Sales Manager - HNWI
Tel: (+974) 4476 6534 Tel: (+974) 4476 6533 Tel: (+974) 4476 6544
saugata.sarkar@qnbfs.com.qa keith.whitney@qnbfs.com.qa sahbi.alkasraoui@qnbfs.com.qa
QNB Financial Services SPC
Contact Center: (+974) 4476 6666
PO Box 24025, Doha, Qatar
DISCLAIMER: This publication has been prepared by QNB Financial Services SPC (“QNBFS”) a wholly-owned subsidiary of Qatar National Bank (“QNB”). QNBFS is regulated by the Qatar
Financial Markets Authority and the Qatar Exchange; QNB is regulated by the Qatar Central Bank. This publication expresses the views and opinions of QNBFS at a given time only. It is not an
offer, promotion or recommendation to buy or sell securities or other investments, nor is it intended to constitute legal, tax, accounting, or financial advice. We therefore strongly advise potential
investors to seek independent professional advice before making any investment decision. Although the information in this report has been obtained from sources that QNBFS believes to be
reliable, we have not independently verified such information and it may not be accurate or complete. While this publication has been prepared with the utmost degree of care by our analysts,
QNBFS does not make any representations warranties as to the accuracy and completeness of the information it may contain, and declines any liability in that respect. QNBFS reserves the right
to amend the views and opinions expressed in this publication at any time. It may also express viewpoints or make investment decisions that differ significantly from, or even contradict, the views
and opinions included in this report.
COPYRIGHT: No part of this document may be reproduced without the explicit written permission of QNBFS.
Page 5 of 5
Source: Bloomberg
Company Name
Price
(May 22)
% Change
5-Day
% Change
YTD
Market Cap.
QR Million TTM P/E P/B Div. Yield
Qatar National Bank 192.00 1.05 11.63 134,348 13.8 2.7 3.6
Qatar Islamic Bank 95.00 (0.73) 37.68 22,448 16.4 2.0 4.2
Commercial Bank of Qatar 67.50 (2.17) 14.41 20,043 12.3 1.3 2.5
Doha Bank 64.00 (2.14) 9.97 16,536 11.6 1.6 7.0
Al Ahli Bank 52.00 (1.70) 22.91 8,590 15.9 2.3 N/A
Qatar International Islamic Bank 86.60 (1.25) 40.36 13,109 17.0 2.6 4.3
Masraf Al Rayan 52.10 2.56 66.45 39,075 22.5 4.0 2.9
Al Khaliji Bank 23.39 0.43 17.01 8,420 15.9 1.5 4.3
National Leasing 32.15 2.88 6.63 1,591 25.4 1.2 4.7
Dlala Holding 40.40 (1.10) 82.81 897 N/M 4.0 N/A
Qatar & Oman Investment 14.40 (0.69) 15.02 454 20.8 1.4 4.2
Islamic Holding Group 71.70 2.72 55.87 287 29.0 4.9 2.4
Banking and Financial Services 265,797
Zad Holding 75.60 (1.82) 8.78 989 9.2 0.7 4.6
Qatar German Co. for Medical Devices 14.45 1.83 4.33 167 N/M 0.9 N/A
Salam International Investment 14.28 0.21 9.76 1,632 12.7 1.0 7.0
Medicare Group 87.70 0.23 67.05 2,468 24.9 3.3 2.1
Qatar Cinema & Film Distribution 41.35 (1.78) 3.12 236 20.5 1.7 N/A
Qatar Fuel 223.90 (3.49) 2.45 18,910 15.7 3.2 3.4
Qatar Meat and Livestock 62.00 (1.74) 19.92 1,116 20.9 4.5 3.4
Al Meera Consumer Goods 184.70 0.38 38.56 3,694 16.8 2.9 4.3
Consumer Goods and Services 29,213
Qatar Industrial Manufacturing 45.30 (2.79) 7.43 2,153 10.4 1.5 N/A
Qatar National Cement 141.00 (1.40) 18.49 6,923 15.5 2.7 4.3
Industries Qatar 183.00 (2.92) 8.35 110,715 15.7 3.8 6.0
Qatari Investors Group 65.80 (2.23) 50.57 8,181 36.2 3.9 1.1
Qatar Electricity and Water 183.40 (2.45) 10.91 20,174 13.6 3.5 3.7
Mannai Corp. 118.00 (1.01) 31.26 5,383 10.6 3.0 4.7
Aamal 17.23 (2.98) 14.87 10,338 19.4 1.5 N/A
Gulf International Services 96.00 (2.93) 96.72 17,841 24.5 6.0 1.7
Mesaieed Petrochemical Holding 32.75 (4.66) N/A 41,144 N/M 3.0 1.1
Industrials 222,852
Qatar Insurance 76.00 (1.55) 42.86 12,201 15.2 2.4 2.6
Doha Insurance 24.50 (2.58) (2.00) 1,225 9.2 1.1 8.2
Qatar General Insurance & Reinsurance 44.00 (0.68) 10.23 3,044 1.4 0.6 2.8
Al Khaleej Takaful Insurance 39.05 1.17 39.08 867 11.7 1.3 N/A
Qatar Islamic Insurance 71.40 0.56 23.32 1,071 16.8 3.9 5.3
Insurance 18,408
United Development 26.15 0.58 21.44 9,259 20.0 0.9 3.6
Barw a Real Estate 39.20 1.16 31.54 15,254 10.3 1.1 5.1
Ezdan Real Estate 27.25 (3.37) 60.29 72,281 58.0 2.4 1.1
Mazaya Qatar Real Estate Development 19.60 (0.96) 75.31 1,960 12.7 1.6 3.8
Real Estate 98,754
Qatar Telecom 148.50 2.13 8.24 47,568 18.2 1.9 2.7
Vodafone Qatar 18.35 (2.03) 71.34 15,513 N/M 2.6 N/A
Telecoms 63,081
Qatar Navigation (Milaha) 94.20 (3.88) 13.49 10,788 11.2 0.9 5.3
Gulf Warehousing 53.90 (2.00) 29.88 2,564 23.3 3.4 2.8
Qatar Gas Transport (Nakilat) 23.51 (5.24) 16.10 13,166 17.2 3.6 4.7
Transportation 26,517
Qatar Exchange 724,621

![Page 2 of 5
News
Economic News
Deposit and loans both grew by 0.6% MoM in the month of
April 2014 – After posting a flat performance (down 0.1%
month-over-month [MoM] in March 2014), loans grew by 0.6%
MoM in April 2014 primarily due to pick-up in credit off-take
from the private sector which posted a growth of 2.2% MoM. On
the other hand, deposits continued with its gradual growth
(+0.6% MoM) and are up 6.5% year-to-date (YTD) vs. 3.8%
growth in the loan book. Hence, the banking sector’s loans-to-
deposits ratio (LDR) stood at 103% at the end of April 2014 vs.
105% at the end of 2013. On the loan book front, total domestic
public sector loans declined by 1.3% MoM but are still up 1.4%
YTD. The government segment’s loan book declined by 0.3%
MoM after a 5.5% MoM growth in March 2014 (+18.6% YTD
2014). Furthermore, government institutions’ segment
(represents ~60% of public sector loans) declined by 2.3%
MoM and is still down 3.7% YTD. Private sector loans grew by
2.2% MoM and are up 5.0% YTD. The Contractors segment
posted a 0.7% decline MoM. Despite this, contractors remain
the best performing segment in the private sector, posting a
growth 12.7% in the first four months of 2014. The General
Trade segment (contributes ~13% to private sector loans) loan
book grew by 1.1% MoM (+11.2% YTD). However, two other
segments, real estate and consumption & others have posted
modest growth in the first four months of 2014. Consumption &
Others (contributes ~29% to private sector loans) increased by
1.2% MoM (+3.5 YTD). Real Estate (contributes ~28% to
private sector loans) inched up by 0.7%. (QCB, QNBFS)
Market & Corporate News
GDI places its third rig into service for Oxy Qatar –
Occidental Petroleum of Qatar (Oxy Qatar) has accepted the
jack-up drilling rig ‘Msheireb’, which was acquired by Gulf
Drilling International (GDI) earlier this year and refurbished for
drilling operations that are set to commence this week. This
was jointly announced by GDI, and Oxy Qatar in Doha.
Msheireb will be the third GDI rig to be placed in service for Oxy
Qatar with other two rigs ‘Al Rayyan’ and ‘Al Wajba’ already
under contract. Msheireb has a 60ft cantilever outreach with
capability to drill to a depth of 25,000ft, operate in a water depth
of 300ft, and accommodate 116 persons on board. (Gulf-
Times.com)
Moody's affirms Qatar International Islamic Bank ratings;
changed outlook to positive from stable – Moody's Investors
Service has today affirmed Qatar International Islamic Bank
(Q.S.C.)'s (QIIK) A3 global long term issuer ratings, Prime-2
short term issuer ratings and D+ standalone bank financial
strength rating (BFSR), which is equivalent to a ba1 baseline
credit assessment (BCA). At the same time, Moody's changed
the outlook on the bank's long-term ratings to positive from
stable. (Moody’s)
Doha Bank to raise capital in 2015 – Doha Bank plans to
raise additional capital in 2015 to underpin fast asset growth
and potential acquisitions, the group chief executive of Qatar’s
fourth-largest bank by assets said yesterday. The bank is
looking at several options to raise capital, such as a rights
issue, R. Seetharaman told reporters at a news conference in
Kuwait. “If our organic expansion is per the growth model we
envisage, then we will need additional capital, which we will
mobilize next year,” he said. (Gulf-times.com)
DHBK sees enhanced potential in Kuwait – Doha Bank’s
(DHBK) Group CEO, Dr. R. Seetharaman said building the
bank’s partnerships in Kuwait is one of the top priorities in the
current fiscal year. Dr. Seetharaman said Kuwait enjoys strong
bilateral trade partnerships with countries such as the US, the
UK, India, Japan, South Korea and China. Kuwaiti companies
are also seeking to establish strong partnerships or to grow
organically in these markets, and DHBK is keen to support their
ambitions through its global representative network. In addition
to full branches in Qatar, Kuwait, and the UAE, DHBK has
representative offices in Canada, the UK, Germany, Turkey,
South Korea, China, Hong Kong, Singapore, Japan, and
Australia. (AmeInfo.com)
VFQS’ March 31, 2014 customer base reaches 1,327,000,
which is right in line with our estimate – Vodafone Qatar
(VFQS) continues to expand its mobile customer base in Qatar,
growing its number of customers by 22% YoY to reach
1,327,000 customers as at March 31, 2014. VFQS’ CEO Kyle
Whitehill said that 62% of Qatar’s population is using VFQS’
services every month, which is a great achievement for the
company’s shareholders, staff and partners. Reported mobile
subscriber base came in around 1% below our estimate of
1,340,149. VFQS reports FY2014 results after its board
meeting on May 27, 2014 and we continue to expect improving
financial metrics. We are projecting QR543mn in revenue for
4QFY2014 (+7% QoQ, +25% YoY). We model net loss to
decline to QR50mn versus QR53mn and QR74mn in December
2013 and March 2013 quarters, respectively. Finally, we
continue to expect VFQS to pay QR0.10 in DPS for FY2014.
We rate VFQS an Underperform with a price target of QR13.95.
(VFQS Press release, QNBFS Research)
KCBK’s Group CEO resigns; BoD to meet on June 3 – Al
Khalij Commercial Bank’s (KCBK) Group CEO Robin McCall
has resigned from his duties citing personal reasons. The
company’s board of directors has accepted his resignation.
However, McCall will continue to work as the CEO until a
suitable replacement is appointed. Meanwhile, KCBK’s BoD will
meet on June 3, 2014 to discuss and approve various
business-related items. We recommend a Market Perform
rating on the stocks with a 12-month target price of QR23.41.
(QE, QNBFS Research)
BRES appoints acting CEO – Barwa Real Estate Company
(BRES) has appointed Ahmad Abdulla Ali Al Abdulla as the
acting CEO for the group, effective from May 19, 2014,
following the resignation of the former Group CEO Abdulla Al
Subaie. Ahmad Al Abdulla had previously served as BRES’
Deputy Group CEO. (QE
Moody's withdraws QAFCO's ratings for its own business
reasons – Moody's Investors Service, (Moody's) has withdrawn
its Aa3 issuer rating for Qatar Fertiliser Company (QAFCO) for
its own business reasons. Our conversation with Moody’s
indicated that there were no QAFCO-specific negative factors
behind the ratings withdrawal. (Bloomberg, QNBFS Research)
Karwa taxi service to be privatized – The Karwa taxi service
in Qatar will be fully privatized by 2017 with six private
companies expected to run the service. Mowasalat, the state
transport company, will remain the regulator for private taxi
operators. Karwa has awarded contracts to four private taxi
companies and two of them are already operating their
services. The contracts awarded would be for a period of five
years and would be renewable. Plans are afoot to increase the
number of private taxi operators to six, with Mowasalat not
operating any taxis and just functioning as the regulator.
(Peninsula Qatar)](data:image/gif;base64,R0lGODlhAQABAIAAAAAAAP///yH5BAEAAAAALAAAAAABAAEAAAIBRAA7)