1. Academy of Engineering
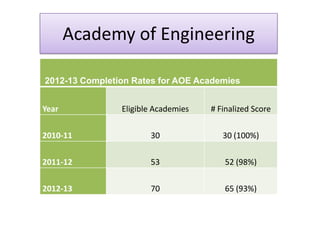
2012-13 Completion Rates for AOE Academies
Year Eligible Academies # Finalized Score
2010-11 30 30 (100%)
2011-12 53 52 (98%)
2012-13 70 65 (93%)
2. Membership Status
2012-13 Membership Status for AOE Academies
Membership
Status Fully implemented %
Not fully
implemented %
Model 7 29% 1 2%
Certified 7 29% 15 37%
Member 8 34% 19 46%
Under Review 2 8% 6 15%
Total 24 100% 41 100%
3.
4. AOE Student Survey
650 seniors (76%) completion rate
12 academies in 7 districts
Charlotte Mecklenburg, NC
Highline Public Schools, WA
Huston Independent School District, TX
Miami Dade Public Schools, FL
New York City Department of Education, NY
Porterville Unified School District, CA
Waco Independent School District, TX
9. Planned Field of Study
n Pct
Arts 28 6.0
Business 39 8.3
Communication 4 0.9
Education 8 1.7
Engineering/Technology 264 56.4
Health Sciences 38 8.1
Humanities 8 1.7
Science 18 3.8
Social Studies 5 1.1
Other 56 12.0
Total 468 100.0
11. Why Not Attend?
Reason N Pct
Not Interested 28 17.7
Not academically ready 8 5.1
Too expensive 33 20.9
Family Obligations 8 5.1
Was not accepted 4 2.5
Prefer to work 11 7.0
Military 20 2.7
Other 46 29.1
Total 158 100.0
12. Assistance Provided by
Academy to Attend College
n Pct
Prepared me to be
successful in college 272 62.2
Provided encouragement
214 49.0
Provided good college
career advice 245 56.1
Assisted in
finding/obtaining
financial aid 115 26.3
13. Financial Aid Received
n Pct
Student Loans 125 28.6
Work Study 48 11.0
Pell Grant 113 25.9
State Sponsored Scholarship 62 14.2
City Sponsored Scholarship 24 5.5
Private Scholarship 38 8.7
University Scholarship 98 22.4
No Financial Aid 147 33.6
14. Attitudes
Statement N Strongl
y
Agree
Agree Disagre
e
Strongl
y
Disagre
e
Don’t
Know
I have a very good
understanding about the
nature of working in the field
of Engineering.
47
7
20.1%
62.7
%
8.0% 2.5% 6.7%
I feel more positive now
about working in the field of
Engineering than I did when
I entered the Academy.
47
7
30.4%
45.9
%
12.8% 4.8% 6.1%
The classes in my academy
are challenging, so I work
harder for my grades.
47
6
22.7%
54.8
%
14.7% 2.7% 5.0%
15. The classes in my academy
have helped to prepare me for
my future career. 473 27.5% 49.9% 12.5% 4.4% 5.7%
My work experience has helped
me to become prepared to enter
the world of work. 474 26.6% 45.4% 10.1% 2.5% 15.4%
Most of my teachers make
learning relevant and
interesting. 476 21.6% 56.1% 13.7% 3.6% 5.0%
The overall climate or
atmosphere at my school is
positive and motivates me to
learn.
475 22.1% 52.0% 14.1% 4.4% 7.4%
Statement N Strong
ly
Agree
Agree Disagre
e
Strongl
y
Disagre
e
Don’t
Know
Attitudes
16. 404 Colleges and Universities Listed for Attendance
NAF articulation
agreements
Johnson and Wales 4 students
NACME partners 5 colleges and
universities
37 students
PLTW partners 2 universities 2 students
Colleges Students Will Attend
17. Recommendations
• Strengthen support services to help students secure
financial aid resources.
• Prepare students for college attendance especially top
tier ones and to receive aid to attend these costly
intuitions.
• Extend articulation agreements and university
partnerships to include those institutions that are being
attended by students and those institutions that NAF
wishes to encourage students to attend.
18. Next Steps
Share survey with NAF departments, survey
participants, and partners.
• Two webinars in June 2013, for NAF staff
• Review survey outcomes with AOE
academies at NAF Next
• Develop presentations for the annual AOE
Counselors Conference in October, 2013.
• Convene partner to refine the survey content
for the coming year.
Editor's Notes
No significant difference
. A total of 76.6% (n=369) of the seniors completing the survey reported taking at least one AP/IB course and 38% (n=183) reported taking at least one dual enrollment course. A total of 20.8% (n=100) reported taking 4 or more AP/IB courses.
A total of 91.4% (n=437) of the students responding indicated that they had plans to attend a post-secondary institution, with a total of 70.7% (n=338) of these indicating that they had plans to attend a four year institution. A recent report by Public Agenda (http://www.publicagenda.org) indicates that among students in four-year schools, 45% work more than 20 hours a week and among those attending community colleges, 60% work more than 20 hours a week.
students did not receive financial aid, which means 66.4% (290) students received some form of aid. This figure is consistent with the national percentage of 65.6% of students receiving some type of aid, as reported by the NCES for 2007-08. Among aid recipients, the numbers will represent duplication since a student can receive multiple types of assistance.