SlideShare a Scribd company logo
1 of 3
Download to read offline
COURSE SUMMARY REPORT
Numeric Responses
Univ. of Washington, Tacoma
Institute of Technology
Term: Winter 2016
TCSS 390 E
Undergraduate Seminar In Css
Course type: Face-to-Face
Online
C
6/8 ( 75%)
Evaluation Delivery:
Evaluation Form:
Responses:
Taught by: Donald Chinn
Instructor Evaluated: Donald Chinn-Assoc Prof
STUDENT ENGAGEMENT
Overall Summative Rating represents the combined responses of students to the four global summative
items and is presented to provide an overall index of the class's quality:
Combined
Median
Adjusted
Combined
Median
4.8 4.4
(0=lowest; 5=highest)
Challenge and Engagement Index (CEI) combines student responses to several IASystem items relating
to how academically challenging students found the course to be and how engaged they were:
CEI: 4.8
(1=lowest; 7=highest)
98831 98831
SUMMATIVE ITEMS
N
Excellent
(5)
Very
Good
(4)
Good
(3)
Fair
(2)
Poor
(1)
Very
Poor
(0) Median
Adjusted
Median
The course as a whole was: 6 50% 33% 17% 4.5 4.1
The course content was: 6 50% 33% 17% 4.5 4.1
The instructor's contribution to the course was: 6 100% 5.0 4.7
The instructor's effectiveness in teaching the subject matter was: 6 83% 17% 4.9 4.5
Relative to other college courses you have taken: N
Much
Higher
(7) (6) (5)
Average
(4) (3) (2)
Much
Lower
(1) Median
Do you expect your grade in this course to be: 5 20% 40% 40% 5.8
The intellectual challenge presented was: 5 20% 60% 20% 6.0
The amount of effort you put into this course was: 5 40% 40% 20% 5.2
The amount of effort to succeed in this course was: 5 20% 20% 60% 4.3
Your involvement in course (doing assignments, attending classes, etc.)
was:
5 20% 60% 20% 6.0
On average, how many hours per week have you spent on this course,
including attending classes, doing readings, reviewing notes, writing
papers and any other course related work?
Class median: 4.5 Hours per credit: 2.2 (N=5)
Under 2 2-3 4-5 6-7 8-9 10-11 12-13 14-15 16-17 18-19 20-21 22 or more
40% 20% 20% 20%
From the total average hours above, how many do you consider were
valuable in advancing your education?
Class median: 4.0 Hours per credit: 2 (N=5)
Under 2 2-3 4-5 6-7 8-9 10-11 12-13 14-15 16-17 18-19 20-21 22 or more
40% 40% 20%
What grade do you expect in this course? Class median: 4.0 (N=5)
A
(3.9-4.0)
A-
(3.5-3.8)
B+
(3.2-3.4)
B
(2.9-3.1)
B-
(2.5-2.8)
C+
(2.2-2.4)
C
(1.9-2.1)
C-
(1.5-1.8)
D+
(1.2-1.4)
D
(0.9-1.1)
D-
(0.7-0.8)
E
(0.0) Pass Credit No Credit
20% 80%
In regard to your academic program, is this course best described as: (N=5)
In your major
A core/distribution
requirement An elective In your minor A program requirement Other
40% 40% 20%
Printed: 3/22/16
Page 1 of 3
© 2014, IASystem, University of Washington
Survey no: 98831
COURSE SUMMARY REPORT
Numeric Responses
Univ. of Washington, Tacoma
Institute of Technology
Term: Winter 2016
STANDARD FORMATIVE ITEMS
N
Excellent
(5)
Very
Good
(4)
Good
(3)
Fair
(2)
Poor
(1)
Very
Poor
(0) Median
Relative
Rank
Course organization was: 6 50% 33% 17% 4.5 11
Instructor's preparation for class was: 6 67% 33% 4.8 10
Instructor as a discussion leader was: 6 67% 33% 4.8 12
Instructor's contribution to discussion was: 6 83% 17% 4.9 6
Conduciveness of class atmosphere to student learning was: 6 67% 17% 17% 4.8 9
Quality of questions or problems raised was: 6 67% 33% 4.8 8
Student confidence in instructor's knowledge was: 6 67% 33% 4.8 15
Instructor's enthusiasm was: 6 100% 5.0 3
Encouragement given students to express themselves was: 6 83% 17% 4.9 5
Instructor's openness to student views was: 6 67% 33% 4.8 17
Interest level of class sessions was: 6 17% 67% 17% 4.0 18
Use of class time was: 6 50% 33% 17% 4.5 16
Instructor's interest in whether students learned was: 6 83% 17% 4.9 4
Amount you learned in the course was: 6 83% 17% 4.9 1
Relevance and usefulness of course content were: 6 83% 17% 4.9 2
Evaluative and grading techniques (tests, papers, projects, etc.) were: 6 50% 33% 17% 4.5 13
Reasonableness of assigned work was: 6 50% 17% 33% 4.5 14
Clarity of student responsibilities and requirements was: 6 67% 17% 17% 4.8 7
Printed: 3/22/16
Page 2 of 3
© 2014, IASystem, University of Washington
Survey no: 98831
COURSE SUMMARY REPORT
Student Comments
Univ. of Washington, Tacoma
Institute of Technology
Term: Winter 2016
TCSS 390 E
Undergraduate Seminar In Css
Course type: Face-to-Face
Online
C
6/8 ( 75%)
Evaluation Delivery:
Evaluation Form:
Responses:
Taught by: Donald Chinn
Instructor Evaluated: Donald Chinn-Assoc Prof
98831 98831
STANDARD OPEN-ENDED QUESTIONS
Was this class intellectually stimulating? Did it stretch your thinking? Why or why not?
1. Great helper course and great content/addition to the core class.
2. Yes, the student teacher did an amazing job with helping and making me expand my knowledge
3. Yes and yes. The class was challenged to use skills beyond what was learned in the course.
What aspects of this class contributed most to your learning?
1. Everything, especially discussions/
2. Worksheets and going over those worksheets in class.
3. The exercises
What aspects of this class detracted from your learning?
2. Nothing
3. none
What suggestions do you have for improving the class?
1. Need to have eclipse/java installed on the computer.
2. nothing
3. None. When students had difficulties in the class, they didn't speak up. That's on them not the instructor.
Printed: 3/22/16
Page 3 of 3
© 2014, IASystem, University of Washington
Survey no: 98831

More Related Content

What's hot

Using Learning Analytics to Assess Innovation & Improve Student Achievement
Using Learning Analytics to Assess Innovation & Improve Student Achievement Using Learning Analytics to Assess Innovation & Improve Student Achievement
Using Learning Analytics to Assess Innovation & Improve Student Achievement John Whitmer, Ed.D.
 
What data from 3 million learners can tell us about effective course design
What data from 3 million learners can tell us about effective course designWhat data from 3 million learners can tell us about effective course design
What data from 3 million learners can tell us about effective course designJohn Whitmer, Ed.D.
 
Results are (coming) in: First Look at Colorado’s Scorecard for Developmenta...
Results are (coming) in: First Look at Colorado’s Scorecard for Developmenta...Results are (coming) in: First Look at Colorado’s Scorecard for Developmenta...
Results are (coming) in: First Look at Colorado’s Scorecard for Developmenta...cccscoetc
 
Adding Up to Success? Assessing Freshman Skills in Information Literacy
Adding Up to Success? Assessing Freshman Skills in Information LiteracyAdding Up to Success? Assessing Freshman Skills in Information Literacy
Adding Up to Success? Assessing Freshman Skills in Information Literacysusangar
 
Good enough because they say so!
Good enough because they say so!Good enough because they say so!
Good enough because they say so!Mark Freeman
 
22 January 2018 HEFCE open event “Using data to increase learning gains and t...
22 January 2018 HEFCE open event “Using data to increase learning gains and t...22 January 2018 HEFCE open event “Using data to increase learning gains and t...
22 January 2018 HEFCE open event “Using data to increase learning gains and t...Bart Rienties
 
Evaluation of the Use of VoiceThread for Assessment
Evaluation of the Use of VoiceThread for AssessmentEvaluation of the Use of VoiceThread for Assessment
Evaluation of the Use of VoiceThread for AssessmentWendy Taleo
 
Students First 2020 - Usage and impact of academic support
Students First 2020 - Usage and impact of academic supportStudents First 2020 - Usage and impact of academic support
Students First 2020 - Usage and impact of academic supportStudiosity.com
 
Using Learning Analytics to Create our 'Preferred Future'
Using Learning Analytics to Create our 'Preferred Future'Using Learning Analytics to Create our 'Preferred Future'
Using Learning Analytics to Create our 'Preferred Future'John Whitmer, Ed.D.
 
OECD Reviews of Evaluation and Assessment in Education: SWEDEN - Stockholm – ...
OECD Reviews of Evaluation and Assessment in Education: SWEDEN - Stockholm – ...OECD Reviews of Evaluation and Assessment in Education: SWEDEN - Stockholm – ...
OECD Reviews of Evaluation and Assessment in Education: SWEDEN - Stockholm – ...EduSkills OECD
 
Student services regional introduction to redesign
Student services regional introduction to redesignStudent services regional introduction to redesign
Student services regional introduction to redesigncccscoetc
 
The Achievement Gap in Online Courses through a Learning Analytics Lens
The Achievement Gap in Online Courses through a Learning Analytics LensThe Achievement Gap in Online Courses through a Learning Analytics Lens
The Achievement Gap in Online Courses through a Learning Analytics LensJohn Whitmer, Ed.D.
 
Presentation eltam portfolios final version
Presentation eltam portfolios final versionPresentation eltam portfolios final version
Presentation eltam portfolios final versionMagdalena Batevska
 
Transfer of Learning research proposal
Transfer of Learning research proposalTransfer of Learning research proposal
Transfer of Learning research proposaljohnpegan
 
Students First 2020 - Embracing and effectively leveraging online student sup...
Students First 2020 - Embracing and effectively leveraging online student sup...Students First 2020 - Embracing and effectively leveraging online student sup...
Students First 2020 - Embracing and effectively leveraging online student sup...Studiosity.com
 
The Virtuous Loop of Learning Analytics & Academic Technology Innovation
The Virtuous Loop of Learning Analytics & Academic Technology Innovation The Virtuous Loop of Learning Analytics & Academic Technology Innovation
The Virtuous Loop of Learning Analytics & Academic Technology Innovation John Whitmer, Ed.D.
 
Open and flexible learning opportunities for all? Findings from the 2016 UCIS...
Open and flexible learning opportunities for all? Findings from the 2016 UCIS...Open and flexible learning opportunities for all? Findings from the 2016 UCIS...
Open and flexible learning opportunities for all? Findings from the 2016 UCIS...RichardM_Walker
 

What's hot (20)

Using Learning Analytics to Assess Innovation & Improve Student Achievement
Using Learning Analytics to Assess Innovation & Improve Student Achievement Using Learning Analytics to Assess Innovation & Improve Student Achievement
Using Learning Analytics to Assess Innovation & Improve Student Achievement
 
What data from 3 million learners can tell us about effective course design
What data from 3 million learners can tell us about effective course designWhat data from 3 million learners can tell us about effective course design
What data from 3 million learners can tell us about effective course design
 
Results are (coming) in: First Look at Colorado’s Scorecard for Developmenta...
Results are (coming) in: First Look at Colorado’s Scorecard for Developmenta...Results are (coming) in: First Look at Colorado’s Scorecard for Developmenta...
Results are (coming) in: First Look at Colorado’s Scorecard for Developmenta...
 
Adding Up to Success? Assessing Freshman Skills in Information Literacy
Adding Up to Success? Assessing Freshman Skills in Information LiteracyAdding Up to Success? Assessing Freshman Skills in Information Literacy
Adding Up to Success? Assessing Freshman Skills in Information Literacy
 
Good enough because they say so!
Good enough because they say so!Good enough because they say so!
Good enough because they say so!
 
22 January 2018 HEFCE open event “Using data to increase learning gains and t...
22 January 2018 HEFCE open event “Using data to increase learning gains and t...22 January 2018 HEFCE open event “Using data to increase learning gains and t...
22 January 2018 HEFCE open event “Using data to increase learning gains and t...
 
Evaluation of the Use of VoiceThread for Assessment
Evaluation of the Use of VoiceThread for AssessmentEvaluation of the Use of VoiceThread for Assessment
Evaluation of the Use of VoiceThread for Assessment
 
Students First 2020 - Usage and impact of academic support
Students First 2020 - Usage and impact of academic supportStudents First 2020 - Usage and impact of academic support
Students First 2020 - Usage and impact of academic support
 
Using Learning Analytics to Create our 'Preferred Future'
Using Learning Analytics to Create our 'Preferred Future'Using Learning Analytics to Create our 'Preferred Future'
Using Learning Analytics to Create our 'Preferred Future'
 
OECD Reviews of Evaluation and Assessment in Education: SWEDEN - Stockholm – ...
OECD Reviews of Evaluation and Assessment in Education: SWEDEN - Stockholm – ...OECD Reviews of Evaluation and Assessment in Education: SWEDEN - Stockholm – ...
OECD Reviews of Evaluation and Assessment in Education: SWEDEN - Stockholm – ...
 
Student services regional introduction to redesign
Student services regional introduction to redesignStudent services regional introduction to redesign
Student services regional introduction to redesign
 
The Achievement Gap in Online Courses through a Learning Analytics Lens
The Achievement Gap in Online Courses through a Learning Analytics LensThe Achievement Gap in Online Courses through a Learning Analytics Lens
The Achievement Gap in Online Courses through a Learning Analytics Lens
 
Presentation eltam portfolios final version
Presentation eltam portfolios final versionPresentation eltam portfolios final version
Presentation eltam portfolios final version
 
Quality Evaluation of the Higher Education Programmes
Quality Evaluation of the Higher Education ProgrammesQuality Evaluation of the Higher Education Programmes
Quality Evaluation of the Higher Education Programmes
 
Transfer of Learning research proposal
Transfer of Learning research proposalTransfer of Learning research proposal
Transfer of Learning research proposal
 
Students First 2020 - Embracing and effectively leveraging online student sup...
Students First 2020 - Embracing and effectively leveraging online student sup...Students First 2020 - Embracing and effectively leveraging online student sup...
Students First 2020 - Embracing and effectively leveraging online student sup...
 
The Virtuous Loop of Learning Analytics & Academic Technology Innovation
The Virtuous Loop of Learning Analytics & Academic Technology Innovation The Virtuous Loop of Learning Analytics & Academic Technology Innovation
The Virtuous Loop of Learning Analytics & Academic Technology Innovation
 
CoLT 2017 - Prof. Dr. Vishna Devi Nadarajah
CoLT 2017 - Prof. Dr. Vishna Devi NadarajahCoLT 2017 - Prof. Dr. Vishna Devi Nadarajah
CoLT 2017 - Prof. Dr. Vishna Devi Nadarajah
 
James gaynor t&l conference presentation-v4
James gaynor  t&l conference presentation-v4James gaynor  t&l conference presentation-v4
James gaynor t&l conference presentation-v4
 
Open and flexible learning opportunities for all? Findings from the 2016 UCIS...
Open and flexible learning opportunities for all? Findings from the 2016 UCIS...Open and flexible learning opportunities for all? Findings from the 2016 UCIS...
Open and flexible learning opportunities for all? Findings from the 2016 UCIS...
 

Similar to CSS Course Summary Report

The effect of an after-school “learning space” on student academic achievemen...
The effect of an after-school “learning space” on student academic achievemen...The effect of an after-school “learning space” on student academic achievemen...
The effect of an after-school “learning space” on student academic achievemen...Neil Commons
 
Required Online Orientation: A Predictor of Success?
Required Online Orientation:  A Predictor of Success?Required Online Orientation:  A Predictor of Success?
Required Online Orientation: A Predictor of Success?ldefelice
 
Students as producers, of high quality engaging assessments to support learning
Students as producers, of high quality engaging assessments to support learningStudents as producers, of high quality engaging assessments to support learning
Students as producers, of high quality engaging assessments to support learningSimon Bates
 
Study on students dropouts in advanced certificate in pre school education pr...
Study on students dropouts in advanced certificate in pre school education pr...Study on students dropouts in advanced certificate in pre school education pr...
Study on students dropouts in advanced certificate in pre school education pr...The Open University of Sri Lanka
 
Study on students dropout in advanced cer 11111
Study on students dropout in advanced cer 11111Study on students dropout in advanced cer 11111
Study on students dropout in advanced cer 11111Senevirathna Peellage
 
TESTA Interactive Masterclass
TESTA Interactive MasterclassTESTA Interactive Masterclass
TESTA Interactive MasterclassTansy Jessop
 
The Anatomy of a 21st Century Educator
The Anatomy of a 21st Century Educator The Anatomy of a 21st Century Educator
The Anatomy of a 21st Century Educator Simon Bates
 
ISETL presentation: Cafeteria Style Grading 10/13/16
ISETL presentation: Cafeteria Style Grading 10/13/16ISETL presentation: Cafeteria Style Grading 10/13/16
ISETL presentation: Cafeteria Style Grading 10/13/16Anne Arendt
 
Online Discussions: Relationships Between Faculty Attitudes, Demographics, an...
Online Discussions: Relationships Between Faculty Attitudes, Demographics, an...Online Discussions: Relationships Between Faculty Attitudes, Demographics, an...
Online Discussions: Relationships Between Faculty Attitudes, Demographics, an...Kelvin Thompson
 
Wsu guest lecture_2015_czlv_v3
Wsu guest lecture_2015_czlv_v3Wsu guest lecture_2015_czlv_v3
Wsu guest lecture_2015_czlv_v3Catherine Zhao
 
Paulette Robinson - Microlearning and Gamification in Policy Leadership
Paulette Robinson - Microlearning and Gamification in Policy LeadershipPaulette Robinson - Microlearning and Gamification in Policy Leadership
Paulette Robinson - Microlearning and Gamification in Policy LeadershipSeriousGamesAssoc
 
Effective Partnerships from Noncredit to Credit in Mathematics
Effective Partnerships from Noncredit to Credit in MathematicsEffective Partnerships from Noncredit to Credit in Mathematics
Effective Partnerships from Noncredit to Credit in Mathematicscrealcsuf
 
Using Analytics to Increase Student Success
Using Analytics to Increase Student SuccessUsing Analytics to Increase Student Success
Using Analytics to Increase Student SuccessDavid Lindrum
 
RtI Models for At-Risk Students in an Urban Setting
RtI Models for At-Risk Students in an Urban SettingRtI Models for At-Risk Students in an Urban Setting
RtI Models for At-Risk Students in an Urban Settingpearson_digital
 
Roadway to Success: The Intersection of Guided Pathways and Z-Degrees
Roadway to Success: The Intersection of Guided Pathways and Z-DegreesRoadway to Success: The Intersection of Guided Pathways and Z-Degrees
Roadway to Success: The Intersection of Guided Pathways and Z-DegreesRegina Gong
 

Similar to CSS Course Summary Report (20)

WI16-TCSS390A-Eval
WI16-TCSS390A-EvalWI16-TCSS390A-Eval
WI16-TCSS390A-Eval
 
Sp131010
Sp131010Sp131010
Sp131010
 
The effect of an after-school “learning space” on student academic achievemen...
The effect of an after-school “learning space” on student academic achievemen...The effect of an after-school “learning space” on student academic achievemen...
The effect of an after-school “learning space” on student academic achievemen...
 
The effect of an after-school “learning space” on student academic achievemen...
The effect of an after-school “learning space” on student academic achievemen...The effect of an after-school “learning space” on student academic achievemen...
The effect of an after-school “learning space” on student academic achievemen...
 
Required Online Orientation: A Predictor of Success?
Required Online Orientation:  A Predictor of Success?Required Online Orientation:  A Predictor of Success?
Required Online Orientation: A Predictor of Success?
 
Students as producers, of high quality engaging assessments to support learning
Students as producers, of high quality engaging assessments to support learningStudents as producers, of high quality engaging assessments to support learning
Students as producers, of high quality engaging assessments to support learning
 
Study on students dropouts in advanced certificate in pre school education pr...
Study on students dropouts in advanced certificate in pre school education pr...Study on students dropouts in advanced certificate in pre school education pr...
Study on students dropouts in advanced certificate in pre school education pr...
 
Study on students dropout in advanced cer 11111
Study on students dropout in advanced cer 11111Study on students dropout in advanced cer 11111
Study on students dropout in advanced cer 11111
 
TESTA Interactive Masterclass
TESTA Interactive MasterclassTESTA Interactive Masterclass
TESTA Interactive Masterclass
 
The Anatomy of a 21st Century Educator
The Anatomy of a 21st Century Educator The Anatomy of a 21st Century Educator
The Anatomy of a 21st Century Educator
 
ISETL presentation: Cafeteria Style Grading 10/13/16
ISETL presentation: Cafeteria Style Grading 10/13/16ISETL presentation: Cafeteria Style Grading 10/13/16
ISETL presentation: Cafeteria Style Grading 10/13/16
 
Practical Work and Assessment to Stimulate Student Participation and Motivati...
Practical Work and Assessment to Stimulate Student Participation and Motivati...Practical Work and Assessment to Stimulate Student Participation and Motivati...
Practical Work and Assessment to Stimulate Student Participation and Motivati...
 
Online Discussions: Relationships Between Faculty Attitudes, Demographics, an...
Online Discussions: Relationships Between Faculty Attitudes, Demographics, an...Online Discussions: Relationships Between Faculty Attitudes, Demographics, an...
Online Discussions: Relationships Between Faculty Attitudes, Demographics, an...
 
Sreb March 2010 5
Sreb March 2010 5Sreb March 2010 5
Sreb March 2010 5
 
Wsu guest lecture_2015_czlv_v3
Wsu guest lecture_2015_czlv_v3Wsu guest lecture_2015_czlv_v3
Wsu guest lecture_2015_czlv_v3
 
Paulette Robinson - Microlearning and Gamification in Policy Leadership
Paulette Robinson - Microlearning and Gamification in Policy LeadershipPaulette Robinson - Microlearning and Gamification in Policy Leadership
Paulette Robinson - Microlearning and Gamification in Policy Leadership
 
Effective Partnerships from Noncredit to Credit in Mathematics
Effective Partnerships from Noncredit to Credit in MathematicsEffective Partnerships from Noncredit to Credit in Mathematics
Effective Partnerships from Noncredit to Credit in Mathematics
 
Using Analytics to Increase Student Success
Using Analytics to Increase Student SuccessUsing Analytics to Increase Student Success
Using Analytics to Increase Student Success
 
RtI Models for At-Risk Students in an Urban Setting
RtI Models for At-Risk Students in an Urban SettingRtI Models for At-Risk Students in an Urban Setting
RtI Models for At-Risk Students in an Urban Setting
 
Roadway to Success: The Intersection of Guided Pathways and Z-Degrees
Roadway to Success: The Intersection of Guided Pathways and Z-DegreesRoadway to Success: The Intersection of Guided Pathways and Z-Degrees
Roadway to Success: The Intersection of Guided Pathways and Z-Degrees
 

CSS Course Summary Report

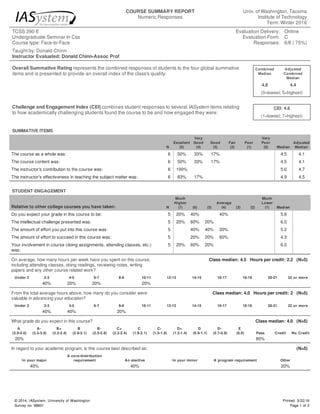
  • 1. COURSE SUMMARY REPORT Numeric Responses Univ. of Washington, Tacoma Institute of Technology Term: Winter 2016 TCSS 390 E Undergraduate Seminar In Css Course type: Face-to-Face Online C 6/8 ( 75%) Evaluation Delivery: Evaluation Form: Responses: Taught by: Donald Chinn Instructor Evaluated: Donald Chinn-Assoc Prof STUDENT ENGAGEMENT Overall Summative Rating represents the combined responses of students to the four global summative items and is presented to provide an overall index of the class's quality: Combined Median Adjusted Combined Median 4.8 4.4 (0=lowest; 5=highest) Challenge and Engagement Index (CEI) combines student responses to several IASystem items relating to how academically challenging students found the course to be and how engaged they were: CEI: 4.8 (1=lowest; 7=highest) 98831 98831 SUMMATIVE ITEMS N Excellent (5) Very Good (4) Good (3) Fair (2) Poor (1) Very Poor (0) Median Adjusted Median The course as a whole was: 6 50% 33% 17% 4.5 4.1 The course content was: 6 50% 33% 17% 4.5 4.1 The instructor's contribution to the course was: 6 100% 5.0 4.7 The instructor's effectiveness in teaching the subject matter was: 6 83% 17% 4.9 4.5 Relative to other college courses you have taken: N Much Higher (7) (6) (5) Average (4) (3) (2) Much Lower (1) Median Do you expect your grade in this course to be: 5 20% 40% 40% 5.8 The intellectual challenge presented was: 5 20% 60% 20% 6.0 The amount of effort you put into this course was: 5 40% 40% 20% 5.2 The amount of effort to succeed in this course was: 5 20% 20% 60% 4.3 Your involvement in course (doing assignments, attending classes, etc.) was: 5 20% 60% 20% 6.0 On average, how many hours per week have you spent on this course, including attending classes, doing readings, reviewing notes, writing papers and any other course related work? Class median: 4.5 Hours per credit: 2.2 (N=5) Under 2 2-3 4-5 6-7 8-9 10-11 12-13 14-15 16-17 18-19 20-21 22 or more 40% 20% 20% 20% From the total average hours above, how many do you consider were valuable in advancing your education? Class median: 4.0 Hours per credit: 2 (N=5) Under 2 2-3 4-5 6-7 8-9 10-11 12-13 14-15 16-17 18-19 20-21 22 or more 40% 40% 20% What grade do you expect in this course? Class median: 4.0 (N=5) A (3.9-4.0) A- (3.5-3.8) B+ (3.2-3.4) B (2.9-3.1) B- (2.5-2.8) C+ (2.2-2.4) C (1.9-2.1) C- (1.5-1.8) D+ (1.2-1.4) D (0.9-1.1) D- (0.7-0.8) E (0.0) Pass Credit No Credit 20% 80% In regard to your academic program, is this course best described as: (N=5) In your major A core/distribution requirement An elective In your minor A program requirement Other 40% 40% 20% Printed: 3/22/16 Page 1 of 3 © 2014, IASystem, University of Washington Survey no: 98831
  • 2. COURSE SUMMARY REPORT Numeric Responses Univ. of Washington, Tacoma Institute of Technology Term: Winter 2016 STANDARD FORMATIVE ITEMS N Excellent (5) Very Good (4) Good (3) Fair (2) Poor (1) Very Poor (0) Median Relative Rank Course organization was: 6 50% 33% 17% 4.5 11 Instructor's preparation for class was: 6 67% 33% 4.8 10 Instructor as a discussion leader was: 6 67% 33% 4.8 12 Instructor's contribution to discussion was: 6 83% 17% 4.9 6 Conduciveness of class atmosphere to student learning was: 6 67% 17% 17% 4.8 9 Quality of questions or problems raised was: 6 67% 33% 4.8 8 Student confidence in instructor's knowledge was: 6 67% 33% 4.8 15 Instructor's enthusiasm was: 6 100% 5.0 3 Encouragement given students to express themselves was: 6 83% 17% 4.9 5 Instructor's openness to student views was: 6 67% 33% 4.8 17 Interest level of class sessions was: 6 17% 67% 17% 4.0 18 Use of class time was: 6 50% 33% 17% 4.5 16 Instructor's interest in whether students learned was: 6 83% 17% 4.9 4 Amount you learned in the course was: 6 83% 17% 4.9 1 Relevance and usefulness of course content were: 6 83% 17% 4.9 2 Evaluative and grading techniques (tests, papers, projects, etc.) were: 6 50% 33% 17% 4.5 13 Reasonableness of assigned work was: 6 50% 17% 33% 4.5 14 Clarity of student responsibilities and requirements was: 6 67% 17% 17% 4.8 7 Printed: 3/22/16 Page 2 of 3 © 2014, IASystem, University of Washington Survey no: 98831
  • 3. COURSE SUMMARY REPORT Student Comments Univ. of Washington, Tacoma Institute of Technology Term: Winter 2016 TCSS 390 E Undergraduate Seminar In Css Course type: Face-to-Face Online C 6/8 ( 75%) Evaluation Delivery: Evaluation Form: Responses: Taught by: Donald Chinn Instructor Evaluated: Donald Chinn-Assoc Prof 98831 98831 STANDARD OPEN-ENDED QUESTIONS Was this class intellectually stimulating? Did it stretch your thinking? Why or why not? 1. Great helper course and great content/addition to the core class. 2. Yes, the student teacher did an amazing job with helping and making me expand my knowledge 3. Yes and yes. The class was challenged to use skills beyond what was learned in the course. What aspects of this class contributed most to your learning? 1. Everything, especially discussions/ 2. Worksheets and going over those worksheets in class. 3. The exercises What aspects of this class detracted from your learning? 2. Nothing 3. none What suggestions do you have for improving the class? 1. Need to have eclipse/java installed on the computer. 2. nothing 3. None. When students had difficulties in the class, they didn't speak up. That's on them not the instructor. Printed: 3/22/16 Page 3 of 3 © 2014, IASystem, University of Washington Survey no: 98831