samwha electric 001820 Algorithm Investment Report
•
0 likes•60 views

samwha electric 001820 Algorithm Investment Report
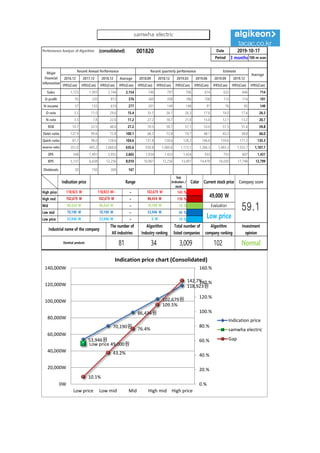
![[Price for scheduled purchasing]
Arbitrarily made
Algorithm stocks Trading Strategies (consolidated) 001820 Date
Period
Gap
(Indication /
stock)
Color
2019-10-17
3 months
Current stock price Evaluation
Stock price rise
probability score
Investment opinion Prospective purchase amount
49,000 W Low price 53.0 Normal 8,800,000 W
Suggested Purchase
Amount 4,516,359 W
Number of stocks
purchased 92
Indication price Range Buying / Selling Buying / Selling [Stocks]
High price 118,923 W 118,923 W~ ~ 102,679 W 143 % -6,444,837 W All selling
High mid 102,679 W 102,679 W ~ 86,434 W 110 % -4,947,595 W All selling
Mid 86,434 W 86,434 W ~ 70,190 W 76 % -3,450,352 W -40
Low mid 70,190 W 70,190 W ~ 53,946 W 43 % -1,953,110 W -28
low price 53,946 W 53,946 W ~ 0 W 10 % -455,868 W -8
Stock price rise
probability score
A Sector 48.3 43.4 46.8 47.0 53.0 48.0
53.0B Sector 36.7 50.4 21.3 47.0 32.9 37.9
Total average
2019.05.21 2019.06.19 2019.07.17 2019.08.14 2019.09.16 2019.10.16
42.5 46.9 34.0 33.3 42.9 42.9
22 % 0 %
2019.06.19 2019.07.17 2019.08.14 2019.09.16 2019.10.16
Total of
increase rate
Total score
A Sector -11 % 7 % 1 % 11 % -10 %
-2 % 47.0B Sector 27 % -137 % 55 % -43 % 13 %
Total average 9 % -38 % -2 %
48
43
47 47
53
48
37
50
21
47
33
38
43
47
34 33
43 43
0
10
20
30
40
50
60
2019.05.21 2019.06.19 2019.07.17 2019.08.14 2019.09.16 2019.10.16
Stock price rise probability score
A sector
B sector
Total average
-11%
7% 1%
11%
-10%
27%
-137%
55%
-43%
13%9%
-38%
-2%
22%
0%
-150%
-100%
-50%
0%
50%
100%
2019.06.19 2019.07.17 2019.08.14 2019.09.16 2019.10.16
Increase rate of stock price rise
A sector
B sector
Total average
Compliance notice
samwha electric](data:image/gif;base64,R0lGODlhAQABAIAAAAAAAP///yH5BAEAAAAALAAAAAABAAEAAAIBRAA7)
Recommended
Recommended
More Related Content
What's hot
What's hot (20)
Similar to samwha electric 001820 Algorithm Investment Report
Similar to samwha electric 001820 Algorithm Investment Report (20)
More from 알고리즘 기업분석 컨설팅-알기컨,algikeon
More from 알고리즘 기업분석 컨설팅-알기컨,algikeon (20)
Recently uploaded
Recently uploaded (20)
samwha electric 001820 Algorithm Investment Report
- 1. Performance Analysis of Algorithm (consolidated) 001820 Date Period 3 months 100-m won 2016.12 2017.12 2018.12 Average 2018.09 2018.12 2019.03 2019.06 2019.09 2019.12 IFRS(Con) IFRS(Con) IFRS(Con) IFRS(Con) IFRS(Con) IFRS(Con) IFRS(Con) IFRS(Con) IFRS(Con) IFRS(Con) IFRS(Con) Sales 1,725 1,993 2,744 2,154 740 797 706 614 632 646 714 O-profit 95 220 813 376 260 208 186 108 113 114 191 N-income 57 155 619 277 201 149 148 97 76 85 149 O-rate 5.5 11.0 29.6 15.4 35.1 26.1 26.3 17.6 18.0 17.6 26.3 N-rate 3.3 7.8 22.6 11.2 27.2 18.7 21.0 15.8 12.1 13.2 20.7 ROE 10.7 22.5 48.6 27.2 70.5 58.7 57.1 53.0 51.5 51.6 59.8 Debt-ratio 127.9 99.6 72.8 100.1 68.2 72.8 74.7 48.1 43.2 38.8 66.0 Quick-ratio 87.2 98.0 128.6 104.6 137.8 128.6 128.2 146.6 159.6 177.2 135.3 reserve-ratio 351.0 495.2 1,060.6 635.6 930.8 1,060.6 1,173.1 1,266.3 1,403.3 1,555.7 1,107.7 EPS 548 1,491 5,955 2,665 1,934 1,433 1,424 933 753 607 1,431 BPS 5,137 6,638 12,256 8,010 10,967 12,256 13,497 14,478 16,030 17,748 12,799 Dividends 50 150 300 167 2019-10-17 Major Financial Information Recent Annual Performance Recent quarterly performance Estimate Average Gap (Indication / stock) Color High price ~ 143 % High mid ~ 110 % Mid ~ 76 % Low mid ~ 43 % Low price ~ 10 % Indication price Range Current stock price Company score 102,679 W 102,679 W 86,434 W 86,434 W 86,434 W 70,190 W Evaluation 118,923 W 118,923 W~ 102,679 W 49,000 W 59.170,190 W 70,190 W 53,946 W Low price Normal 53,946 W 53,946 W 0 W Industrial name of the company The number of All industries Algorithm Industry ranking Total number of listed companies Algorithm company ranking Investment opinion Electrical products 81 34 3,009 102 53,946원 70,190원 86,434원 102,679원 118,923원 Low price 49,000원 10.1% 43.2% 76.4% 109.5% 142.7% 0.% 20.% 40.% 60.% 80.% 100.% 120.% 140.% 160.% 0W 20,000W 40,000W 60,000W 80,000W 100,000W 120,000W 140,000W Low price Low mid Mid High mid High price Indication price chart (Consolidated) Indication price samwha electric Gap samwha electric
- 2. [Price for scheduled purchasing] Arbitrarily made Algorithm stocks Trading Strategies (consolidated) 001820 Date Period Gap (Indication / stock) Color 2019-10-17 3 months Current stock price Evaluation Stock price rise probability score Investment opinion Prospective purchase amount 49,000 W Low price 53.0 Normal 8,800,000 W Suggested Purchase Amount 4,516,359 W Number of stocks purchased 92 Indication price Range Buying / Selling Buying / Selling [Stocks] High price 118,923 W 118,923 W~ ~ 102,679 W 143 % -6,444,837 W All selling High mid 102,679 W 102,679 W ~ 86,434 W 110 % -4,947,595 W All selling Mid 86,434 W 86,434 W ~ 70,190 W 76 % -3,450,352 W -40 Low mid 70,190 W 70,190 W ~ 53,946 W 43 % -1,953,110 W -28 low price 53,946 W 53,946 W ~ 0 W 10 % -455,868 W -8 Stock price rise probability score A Sector 48.3 43.4 46.8 47.0 53.0 48.0 53.0B Sector 36.7 50.4 21.3 47.0 32.9 37.9 Total average 2019.05.21 2019.06.19 2019.07.17 2019.08.14 2019.09.16 2019.10.16 42.5 46.9 34.0 33.3 42.9 42.9 22 % 0 % 2019.06.19 2019.07.17 2019.08.14 2019.09.16 2019.10.16 Total of increase rate Total score A Sector -11 % 7 % 1 % 11 % -10 % -2 % 47.0B Sector 27 % -137 % 55 % -43 % 13 % Total average 9 % -38 % -2 % 48 43 47 47 53 48 37 50 21 47 33 38 43 47 34 33 43 43 0 10 20 30 40 50 60 2019.05.21 2019.06.19 2019.07.17 2019.08.14 2019.09.16 2019.10.16 Stock price rise probability score A sector B sector Total average -11% 7% 1% 11% -10% 27% -137% 55% -43% 13%9% -38% -2% 22% 0% -150% -100% -50% 0% 50% 100% 2019.06.19 2019.07.17 2019.08.14 2019.09.16 2019.10.16 Increase rate of stock price rise A sector B sector Total average Compliance notice samwha electric
- 3. 정보와 완전 정보 결 투자판단 있습니 위배 무단으 숙지하 Compliance notice ①The information provided byThe Algorithm Company Analysis Consulting is obtained through reliable data and information andThe Algorithm Company Analysis Program (TACAP), but its accuracy or completeness are not guaranteed. Furthermore, it may change over time.Therefore, we are not legally responsible for the results of the data provided byThe Algorithm Company Analysis Consulting because of information errors or omissions. ②The Algorithm Company Analysis Consulting and all the information provided on it site are reference materials for investment decisions and the final responsibility of investment is up to users utilizing this information. ③The Algorithm Company Analysis Consulting and its site do not do anything that violates the related laws such as discretionary transaction. ④ Users can not reallocate and recycle the information provided by The Algorithm Company Analysis Consulting firm let alone the information provided by its Site. ⑤ Be sure to know about application period of this algorithm analysis report in order to improve its accuracy. Tel : 070 - 4667 - 5009 Email : tacac@tacac.co.kr Homepage : tacac.co.kr Blog : tacac.blog.me SERVICES M&A, IPO, RECOVER, CORPORATE RESTRUCTURING, MANAGEMENT OF TECHNOLOGY, BUSINESS STRATEGY, FAMILY BUSINESS Request : http://tacac.co.kr/?page_id=1374 ① obtained thro Program (TA it data provided errors or omi ② site are refere investment is ③ violates the re ④ Company An ⑤ to improve its