samsung electronics 005930 Algorithm Investment Report
•
0 likes•87 views

This document provides a performance analysis and stock trading strategies for Algorithm company (consolidated) over several periods from 2017-2020. It includes key financial metrics such as sales, operating profit, net income, operating rate, and more. It also evaluates the company's current stock price, provides an indication price range and analysis, and suggests purchasing amounts and number of stocks to buy based on the analysis.
![[Price for scheduled purchasing]
Arbitrarily made
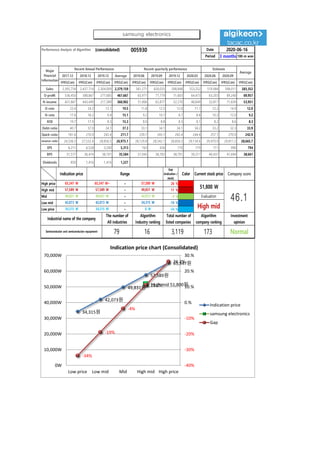
Algorithm stocks Trading Strategies (consolidated) 005930 Date
Period
Gap
(Indication /
stock)
Color
2020-06-16
3 months
Current stock price Evaluation
Stock price rise
probability score
Investment opinion Prospective purchase amount
51,800 W High mid 51.1 Normal 2,500,000 W
Suggested Purchase
Amount 1,022,287 W
Number of stocks
purchased 20
Indication price Range Buying / Selling Buying / Selling [Stocks]
High price 65,347 W 65,347 W~ ~ 57,589 W 26 % -267,360 W -4
High mid 57,589 W 57,589 W ~ 49,831 W 11 % -114,253 W -2
Mid 49,831 W 49,831 W ~ 42,073 W -4 % 38,854 W 1
Low mid 42,073 W 42,073 W ~ 34,315 W -19 % 191,960 W 5
low price 34,315 W 34,315 W ~ 0 W -34 % 345,067 W 10
Stock price rise
probability score
A Sector 46.8 42.1 44.7 47.2 45.3 42.5
51.1B Sector 15.0 36.3 62.1 47.2 29.2 33.8
Total average
2020.01.17 2020.02.18 2020.03.17 2020.04.14 2020.05.18 2020.06.15
30.9 39.2 53.4 22.9 37.2 38.1
38 % 2 %
2020.02.18 2020.03.17 2020.04.14 2020.05.18 2020.06.15
Total of
increase rate
Total score
A Sector -11 % 6 % 5 % -4 % -7 %
-9 % 50.7B Sector 59 % 42 % -32 % -62 % 14 %
Total average 21 % 27 % -133 %
47
42 45 47 45 42
15
36
62
47
29
3431
39
53
23
37 38
0
10
20
30
40
50
60
70
2020.01.17 2020.02.18 2020.03.17 2020.04.14 2020.05.18 2020.06.15
Stock price rise probability score
A sector
B sector
Total average
-11%
6% 5% -4% -7%
59%
42%
-32%
-62%
14%21% 27%
-133%
38%
2%
-150%
-100%
-50%
0%
50%
100%
2020.02.18 2020.03.17 2020.04.14 2020.05.18 2020.06.15
Increase rate of stock price rise
A sector
B sector
Total average
samsung electronics](data:image/gif;base64,R0lGODlhAQABAIAAAAAAAP///yH5BAEAAAAALAAAAAABAAEAAAIBRAA7)
Recommended
Recommended
More Related Content
What's hot
What's hot (20)
Similar to samsung electronics 005930 Algorithm Investment Report
Similar to samsung electronics 005930 Algorithm Investment Report (20)
More from 알고리즘 기업분석 컨설팅-알기컨,algikeon
More from 알고리즘 기업분석 컨설팅-알기컨,algikeon (20)
Recently uploaded
Recently uploaded (10)
samsung electronics 005930 Algorithm Investment Report
- 1. Performance Analysis of Algorithm (consolidated) 005930 Date Period 3 months 100-m won 2017.12 2018.12 2019.12 Average 2019.06 2019.09 2019.12 2020.03 2020.06 2020.09 IFRS(Con) IFRS(Con) IFRS(Con) IFRS(Con) IFRS(Con) IFRS(Con) IFRS(Con) IFRS(Con) IFRS(Con) IFRS(Con) IFRS(Con) Sales 2,395,754 2,437,714 2,304,009 2,379,159 561,271 620,035 598,848 553,252 519,984 598,011 583,352 O-profit 536,450 588,867 277,685 467,667 65,971 77,779 71,603 64,473 63,203 89,240 69,957 N-income 421,867 443,449 217,389 360,902 51,806 62,877 52,270 48,849 52,817 71,839 53,951 O-rate 22.4 24.2 12.1 19.5 11.8 12.5 12.0 11.7 12.2 14.9 12.0 N-rate 17.6 18.2 9.4 15.1 9.2 10.1 8.7 8.8 10.2 12.0 9.2 ROE 19.7 17.9 8.3 15.3 8.0 8.8 8.3 8.1 8.2 8.6 8.3 Debt-ratio 40.7 37.0 34.1 37.3 33.1 34.1 34.1 34.2 33.2 32.3 33.9 Quick-ratio 181.6 210.9 242.4 211.7 239.7 245.1 242.4 244.4 257.1 270.9 242.9 reserve-ratio 24,536.5 27,532.4 28,856.5 26,975.1 28,129.8 28,542.1 28,856.5 29,134.6 29,470.9 29,811.2 28,665.7 EPS 6,211 6,528 3,200 5,313 763 926 770 719 711 990 794 BPS 31,577 36,474 38,701 35,584 37,945 38,783 38,701 39,217 40,437 41,694 38,661 Dividends 850 1,416 1,416 1,227 2020-06-16 Major Financial Information Recent Annual Performance Recent quarterly performance Estimate Average Gap (Indication / stock) Color High price ~ 26 % High mid ~ 11 % Mid ~ -4 % Low mid ~ -19 % Low price ~ -34 % Indication price Range Current stock price Company score 57,589 W 57,589 W 49,831 W 49,831 W 49,831 W 42,073 W Evaluation 65,347 W 65,347 W~ 57,589 W 51,800 W 46.142,073 W 42,073 W 34,315 W High mid Normal 34,315 W 34,315 W 0 W Industrial name of the company The number of All industries Algorithm Industry ranking Total number of listed companies Algorithm company ranking Investment opinion Semiconductor and semiconductor equipment 79 16 3,119 173 34,315원 42,073원 49,831원 57,589원 65,347원 High mid 51,800원 -34% -19% -4% 11.2% 26.2% -40% -30% -20% -10% 0.% 10.% 20.% 30.% 0W 10,000W 20,000W 30,000W 40,000W 50,000W 60,000W 70,000W Low price Low mid Mid High mid High price Indication price chart (Consolidated) Indication price samsung electronics Gap samsung electronics
- 2. [Price for scheduled purchasing] Arbitrarily made Algorithm stocks Trading Strategies (consolidated) 005930 Date Period Gap (Indication / stock) Color 2020-06-16 3 months Current stock price Evaluation Stock price rise probability score Investment opinion Prospective purchase amount 51,800 W High mid 51.1 Normal 2,500,000 W Suggested Purchase Amount 1,022,287 W Number of stocks purchased 20 Indication price Range Buying / Selling Buying / Selling [Stocks] High price 65,347 W 65,347 W~ ~ 57,589 W 26 % -267,360 W -4 High mid 57,589 W 57,589 W ~ 49,831 W 11 % -114,253 W -2 Mid 49,831 W 49,831 W ~ 42,073 W -4 % 38,854 W 1 Low mid 42,073 W 42,073 W ~ 34,315 W -19 % 191,960 W 5 low price 34,315 W 34,315 W ~ 0 W -34 % 345,067 W 10 Stock price rise probability score A Sector 46.8 42.1 44.7 47.2 45.3 42.5 51.1B Sector 15.0 36.3 62.1 47.2 29.2 33.8 Total average 2020.01.17 2020.02.18 2020.03.17 2020.04.14 2020.05.18 2020.06.15 30.9 39.2 53.4 22.9 37.2 38.1 38 % 2 % 2020.02.18 2020.03.17 2020.04.14 2020.05.18 2020.06.15 Total of increase rate Total score A Sector -11 % 6 % 5 % -4 % -7 % -9 % 50.7B Sector 59 % 42 % -32 % -62 % 14 % Total average 21 % 27 % -133 % 47 42 45 47 45 42 15 36 62 47 29 3431 39 53 23 37 38 0 10 20 30 40 50 60 70 2020.01.17 2020.02.18 2020.03.17 2020.04.14 2020.05.18 2020.06.15 Stock price rise probability score A sector B sector Total average -11% 6% 5% -4% -7% 59% 42% -32% -62% 14%21% 27% -133% 38% 2% -150% -100% -50% 0% 50% 100% 2020.02.18 2020.03.17 2020.04.14 2020.05.18 2020.06.15 Increase rate of stock price rise A sector B sector Total average samsung electronics
- 3. 정보와 완전 정보 결 투자판단 있습니 위배 무단으 숙지하 Compliance notice ① The information provided by The Algorithm Company Analysis Consulting is obtained through reliable data and information and The Algorithm Company Analysis Program (TACAP), but its accuracy or completeness are not guaranteed. Furthermore, it may change over time.Therefore, we are not legally responsible for the results of the data provided by The Algorithm Company Analysis Consulting because of information errors or omissions. ② The Algorithm Company Analysis Consulting and all the information provided on it site are reference materials for investment decisions and the final responsibility of investment is up to users utilizing this information. ③ The Algorithm Company Analysis Consulting and its site do not do anything that violates the related laws such as discretionary transaction. ④ Users can not reallocate and recycle the information provided by The Algorithm Company Analysis Consulting firm let alone the information provided by its Site. ⑤ Be sure to know about application period of this algorithm analysis report in order to improve its accuracy. Tel : 070 - 4667 - 5009 Email : tacac@tacac.co.kr Homepage : tacac.co.kr Blog : tacac.blog.me SERVICES M&A, IPO, RECOVER, CORPORATE RESTRUCTURING, MANAGEMENT OF TECHNOLOGY, BUSINESS STRATEGY, FAMILY BUSINESS Request : http://tacac.co.kr/?page_id=1374 ① Consulting is o The Algorithm accuracy or com change over tim results of the d Consulting bec ② information pr investment dec up ③ do anything th transaction. ④ The Algorithm information pr ⑤ analysis report