daewoongholdings 003090 Algorithm Investment Report
•
0 likes•123 views

This document provides a performance analysis of an algorithm (consolidated) from 2016-2020. It includes key financial metrics like sales, operating profit, net income, debt ratio, and earnings per share. It also evaluates the company's stock price against indication price ranges, and provides a stock price rise probability score and investment opinion.
![[Price for scheduled purchasing]
Arbitrarily made
Algorithm stocks Trading Strategies (consolidated) 003090 Date
Period
Gap
(Indication /
stock)
Color
low price 13,281 W 13,281 W ~ 0 W 37 % -1,411,726 W -106
Low mid 16,211 W 16,211 W ~ 13,281 W 67 % -2,563,222 W -158
Mid 19,140 W 19,140 W ~ 16,211 W 98 % -3,714,719 W -194
High mid 22,070 W 22,070 W ~ 19,140 W 128 % -4,866,215 W All selling
Suggested Purchase
Amount 3,808,963 W
Number of stocks
purchased 393
Indication price Range Buying / Selling Buying / Selling [Stocks]
High price 24,999 W 24,999 W~ ~ 22,070 W 158 % -6,017,711 W All selling
2020-03-12
3 months
Current stock price Evaluation
Stock price rise
probability score
Investment opinion Prospective purchase amount
9,690 W Low price 50.1 Normal 8,000,000 W
51.0 49.0 45.8 43.3 34.3 52.1
2019.10.16 2019.11.13 2019.12.11 2020.01.13 2020.02.12 2020.03.11
Stock price rise
probability score
A Sector 44.8 48.5 49.5 47.8 48.5 46.0
50.1B Sector 57.1 49.6 42.1 47.8 20.0 58.3
Total average
2019.12.11 2020.01.13 2020.02.12 2020.03.11
Total of
increase rate
Total score
A Sector 8 % 2 % -3 % 1 % -6 %
-2 % 45.0B Sector -15 % -18 % 12 % -139 % 66 %
Total average -4 % -7 % -6 % -27 % 34 %
2019.11.13
45
49 49 48 49 46
57
50
42
48
20
58
51 49
46 43
34
52
0
10
20
30
40
50
60
70
2019.10.16 2019.11.13 2019.12.11 2020.01.13 2020.02.12 2020.03.11
Stock price rise probability score
A sector
B sector
Total average
8% 2% -3% 1% -6%-15% -18%
12%
-139%
66%
-4% -7% -6%
-27%
34%
-150%
-100%
-50%
0%
50%
100%
2019.11.13 2019.12.11 2020.01.13 2020.02.12 2020.03.11
Increase rate of stock price rise
A sector
B sector
Total average
daewoongholdings](data:image/gif;base64,R0lGODlhAQABAIAAAAAAAP///yH5BAEAAAAALAAAAAABAAEAAAIBRAA7)
Recommended
Recommended
More Related Content
What's hot
What's hot (20)
Similar to daewoongholdings 003090 Algorithm Investment Report
Similar to daewoongholdings 003090 Algorithm Investment Report (20)
More from 알고리즘 기업분석 컨설팅-알기컨,algikeon
More from 알고리즘 기업분석 컨설팅-알기컨,algikeon (20)
Recently uploaded
Recently uploaded (8)
daewoongholdings 003090 Algorithm Investment Report
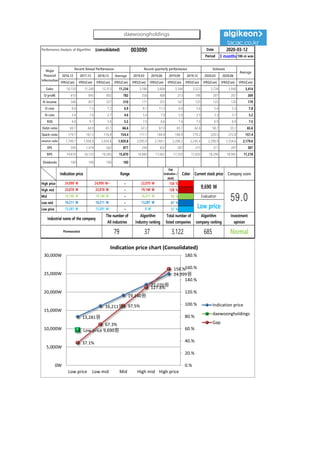
- 1. Performance Analysis of Algorithm (consolidated) 003090 Date Period 3 months 100-m won 2016.12 2017.12 2018.12 Average 2019.03 2019.06 2019.09 2019.12 2020.03 2020.06 IFRS(Con) IFRS(Con) IFRS(Con) IFRS(Con) IFRS(Con) IFRS(Con) IFRS(Con) IFRS(Con) IFRS(Con) IFRS(Con) IFRS(Con) Sales 10,150 11,240 12,313 11,234 3,186 3,604 3,344 3,523 3,726 3,940 3,414 O-profit 610 845 892 782 258 408 213 196 201 207 269 N-income 346 857 327 510 171 251 167 125 123 120 179 O-rate 6.0 7.5 7.2 6.9 8.1 11.3 6.4 5.6 5.4 5.3 7.8 N-rate 3.4 7.6 2.7 4.6 5.4 7.0 5.0 3.5 3.3 3.1 5.2 ROE 4.0 9.1 3.4 5.5 7.0 8.6 7.4 7.0 6.9 6.9 7.5 Debt-ratio 69.7 64.9 65.1 66.6 67.2 67.0 65.7 62.6 58.7 55.1 65.6 Quick-ratio 179.7 167.2 116.4 154.4 117.1 164.4 168.9 179.2 220.5 272.8 157.4 reserve-ratio 1,749.1 1,958.8 2,054.6 1,920.8 2,095.9 2,169.1 2,208.2 2,245.4 2,298.9 2,354.6 2,179.6 EPS 595 1,474 562 877 294 432 287 215 211 207 307 BPS 14,870 16,155 16,585 15,870 16,800 17,062 17,359 17,650 18,296 18,965 17,218 Dividends 100 100 100 100 Major Financial Information Recent Annual Performance Recent quarterly performance Estimate Average 2020-03-12 Gap (Indication / stock) Color High price ~ 158 % High mid ~ 128 % Mid ~ 98 % Low mid ~ 67 % Low price ~ 37 % Normal 13,281 W 13,281 W 0 W Industrial name of the company The number of All industries Algorithm Industry ranking Total number of listed companies Algorithm company ranking Investment opinion Pharmaceutical 79 37 3,122 685 22,070 W 22,070 W 19,140 W 19,140 W 19,140 W 16,211 W Evaluation 24,999 W 24,999 W~ 22,070 W 9,690 W 59.016,211 W 16,211 W 13,281 W Low price Indication price Range Current stock price Company score 13,281원 16,211원 19,140원 22,070원 24,999원 Low price 9,690원 37.1% 67.3% 97.5% 127.8% 158.% 0.% 20.% 40.% 60.% 80.% 100.% 120.% 140.% 160.% 180.% 0W 5,000W 10,000W 15,000W 20,000W 25,000W 30,000W Low price Low mid Mid High mid High price Indication price chart (Consolidated) Indication price daewoongholdings Gap daewoongholdings
- 2. [Price for scheduled purchasing] Arbitrarily made Algorithm stocks Trading Strategies (consolidated) 003090 Date Period Gap (Indication / stock) Color low price 13,281 W 13,281 W ~ 0 W 37 % -1,411,726 W -106 Low mid 16,211 W 16,211 W ~ 13,281 W 67 % -2,563,222 W -158 Mid 19,140 W 19,140 W ~ 16,211 W 98 % -3,714,719 W -194 High mid 22,070 W 22,070 W ~ 19,140 W 128 % -4,866,215 W All selling Suggested Purchase Amount 3,808,963 W Number of stocks purchased 393 Indication price Range Buying / Selling Buying / Selling [Stocks] High price 24,999 W 24,999 W~ ~ 22,070 W 158 % -6,017,711 W All selling 2020-03-12 3 months Current stock price Evaluation Stock price rise probability score Investment opinion Prospective purchase amount 9,690 W Low price 50.1 Normal 8,000,000 W 51.0 49.0 45.8 43.3 34.3 52.1 2019.10.16 2019.11.13 2019.12.11 2020.01.13 2020.02.12 2020.03.11 Stock price rise probability score A Sector 44.8 48.5 49.5 47.8 48.5 46.0 50.1B Sector 57.1 49.6 42.1 47.8 20.0 58.3 Total average 2019.12.11 2020.01.13 2020.02.12 2020.03.11 Total of increase rate Total score A Sector 8 % 2 % -3 % 1 % -6 % -2 % 45.0B Sector -15 % -18 % 12 % -139 % 66 % Total average -4 % -7 % -6 % -27 % 34 % 2019.11.13 45 49 49 48 49 46 57 50 42 48 20 58 51 49 46 43 34 52 0 10 20 30 40 50 60 70 2019.10.16 2019.11.13 2019.12.11 2020.01.13 2020.02.12 2020.03.11 Stock price rise probability score A sector B sector Total average 8% 2% -3% 1% -6%-15% -18% 12% -139% 66% -4% -7% -6% -27% 34% -150% -100% -50% 0% 50% 100% 2019.11.13 2019.12.11 2020.01.13 2020.02.12 2020.03.11 Increase rate of stock price rise A sector B sector Total average daewoongholdings
- 3. 정보와 완전 정보 결 투자판단 있습니 위배 무단으 숙지하 Compliance notice ① The information provided by The Algorithm Company Analysis Consulting is obtained through reliable data and information and The Algorithm Company Analysis Program (TACAP), but its accuracy or completeness are not guaranteed. Furthermore, it may change over time.Therefore, we are not legally responsible for the results of the data provided by The Algorithm Company Analysis Consulting because of information errors or omissions. ② The Algorithm Company Analysis Consulting and all the information provided on it site are reference materials for investment decisions and the final responsibility of investment is up to users utilizing this information. ③ The Algorithm Company Analysis Consulting and its site do not do anything that violates the related laws such as discretionary transaction. ④ Users can not reallocate and recycle the information provided by The Algorithm Company Analysis Consulting firm let alone the information provided by its Site. ⑤ Be sure to know about application period of this algorithm analysis report in order to improve its accuracy. Tel : 070 - 4667 - 5009 Email : tacac@tacac.co.kr Homepage : tacac.co.kr Blog : tacac.blog.me SERVICES M&A, IPO, RECOVER, CORPORATE RESTRUCTURING, MANAGEMENT OF TECHNOLOGY, BUSINESS STRATEGY, FAMILY BUSINESS Request : http://tacac.co.kr/?page_id=1374 ① Consulting is o The Algorithm accuracy or com change over tim results of the d Consulting bec ② information pr investment dec up ③ do anything th transaction. ④ The Algorithm information pr ⑤ analysis report