chong kun dang holdings 001630 Algorithm Investment Report
•
0 likes•132 views

chong kun dang holdings 001630 Algorithm Investment Report
![[Price for scheduled purchasing]
Arbitrarily made
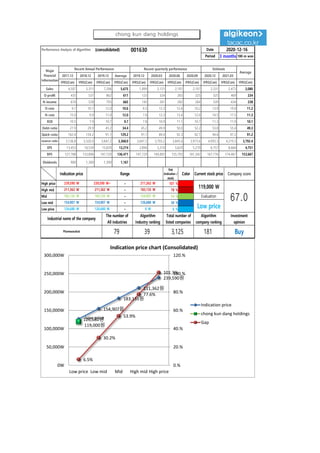
Algorithm stocks Trading Strategies (consolidated) 001630 Date
Period
Gap
(Indication /
stock)
Color
2020-12-16
3 months
Current stock price Evaluation
Stock price rise
probability score
Investment opinion Prospective purchase amount
119,000 W Low price 57.4 Buy 14,000,000 W
Suggested Purchase
Amount 8,237,844 W
Number of stocks
purchased 69
Indication price Range Buying / Selling Buying / Selling [Stocks]
High price 239,590 W 239,590 W~ ~ 211,362 W 101 % -8,347,898 W All selling
High mid 211,362 W 211,362 W ~ 183,135 W 78 % -6,393,833 W -30
Mid 183,135 W 183,135 W ~ 154,907 W 54 % -4,439,768 W -24
Low mid 154,907 W 154,907 W ~ 126,680 W 30 % -2,485,703 W -16
low price 126,680 W 126,680 W ~ 0 W 6 % -531,638 W -4
Stock price rise
probability score
A Sector 47.1 46.8 48.1 43.5 46.6 43.6
57.4B Sector 28.8 40.0 34.2 43.5 30.0 34.2
Total average
2020.07.21 2020.08.19 2020.09.16 2020.10.20 2020.11.17 2020.12.15
37.9 43.4 41.1 35.0 38.3 38.9
9 % 2 %
2020.08.19 2020.09.16 2020.10.20 2020.11.17 2020.12.15
Total of
increase rate
Total score
A Sector -1 % 3 % -10 % 7 % -7 %
-0 % 47.0B Sector 28 % -17 % 21 % -45 % 12 %
Total average 13 % -5 % -17 %
47 47 48
44
47
44
29
40
34
44
30
34
38
43 41
35
38 39
0
10
20
30
40
50
60
2020.07.21 2020.08.19 2020.09.16 2020.10.20 2020.11.17 2020.12.15
Stock price rise probability score
A sector
B sector
Total average
-1% 3%
-10%
7%
-7%
28%
-17%
21%
-45%
12%13%
-5%
-17%
9%
2%
-60%
-40%
-20%
0%
20%
40%
2020.08.19 2020.09.16 2020.10.20 2020.11.17 2020.12.15
Increase rate of stock price rise
A sector
B sector
Total average
chong kun dang holdings](data:image/gif;base64,R0lGODlhAQABAIAAAAAAAP///yH5BAEAAAAALAAAAAABAAEAAAIBRAA7)
Recommended
Recommended
More Related Content
What's hot
What's hot (20)
Similar to chong kun dang holdings 001630 Algorithm Investment Report
Similar to chong kun dang holdings 001630 Algorithm Investment Report (20)
More from 알고리즘 기업분석 컨설팅-알기컨,algikeon
More from 알고리즘 기업분석 컨설팅-알기컨,algikeon (20)
Recently uploaded
Recently uploaded (20)
chong kun dang holdings 001630 Algorithm Investment Report
- 1. Performance Analysis of Algorithm (consolidated) 001630 Date Period 3 months 100-m won 2017.12 2018.12 2019.12 Average 2019.12 2020.03 2020.06 2020.09 2020.12 2021.03 IFRS(Con) IFRS(Con) IFRS(Con) IFRS(Con) IFRS(Con) IFRS(Con) IFRS(Con) IFRS(Con) IFRS(Con) IFRS(Con) IFRS(Con) Sales 4,507 5,311 7,206 5,675 1,899 2,121 2,101 2,197 2,331 2,473 2,080 O-profit 435 537 862 611 123 324 265 225 325 469 234 N-income 674 528 793 665 145 261 282 264 339 434 238 O-rate 9.7 10.1 12.0 10.6 6.5 15.3 12.6 10.2 13.9 19.0 11.2 N-rate 15.0 9.9 11.0 12.0 7.6 12.3 13.4 12.0 14.5 17.5 11.3 ROE 10.5 7.9 10.7 9.7 7.8 10.9 11.1 10.7 11.3 11.9 10.1 Debt-ratio 27.9 29.9 45.2 34.4 45.2 49.9 50.0 52.2 53.8 55.4 49.3 Quick-ratio 162.4 134.2 91.1 129.2 91.1 89.4 92.3 92.1 94.6 97.2 91.2 reserve-ratio 3,136.8 3,320.0 3,647.2 3,368.0 3,647.2 3,703.2 3,845.6 3,973.6 4,093.3 4,219.3 3,792.4 EPS 13,453 10,539 15,829 13,274 2,894 5,210 5,629 5,270 6,757 8,664 4,751 BPS 127,788 133,896 147,729 136,471 147,729 149,805 155,793 161,342 167,776 174,467 153,667 Dividends 900 1,300 1,300 1,167 2020-12-16 Major Financial Information Recent Annual Performance Recent quarterly performance Estimate Average Gap (Indication / stock) Color High price ~ 101 % High mid ~ 78 % Mid ~ 54 % Low mid ~ 30 % Low price ~ 6 % Indication price Range Current stock price Company score 211,362 W 211,362 W 183,135 W 183,135 W 183,135 W 154,907 W Evaluation 239,590 W 239,590 W~ 211,362 W 119,000 W 67.0154,907 W 154,907 W 126,680 W Low price Buy 126,680 W 126,680 W 0 W Industrial name of the company The number of All industries Algorithm Industry ranking Total number of listed companies Algorithm company ranking Investment opinion Pharmaceutical 79 39 3,125 181 126,680원 154,907원 183,135원 211,362원 239,590원 Low price 119,000원 6.5% 30.2% 53.9% 77.6% 101.3% 0.% 20.% 40.% 60.% 80.% 100.% 120.% 0W 50,000W 100,000W 150,000W 200,000W 250,000W 300,000W Low price Low mid Mid High mid High price Indication price chart (Consolidated) Indication price chong kun dang holdings Gap chong kun dang holdings
- 2. [Price for scheduled purchasing] Arbitrarily made Algorithm stocks Trading Strategies (consolidated) 001630 Date Period Gap (Indication / stock) Color 2020-12-16 3 months Current stock price Evaluation Stock price rise probability score Investment opinion Prospective purchase amount 119,000 W Low price 57.4 Buy 14,000,000 W Suggested Purchase Amount 8,237,844 W Number of stocks purchased 69 Indication price Range Buying / Selling Buying / Selling [Stocks] High price 239,590 W 239,590 W~ ~ 211,362 W 101 % -8,347,898 W All selling High mid 211,362 W 211,362 W ~ 183,135 W 78 % -6,393,833 W -30 Mid 183,135 W 183,135 W ~ 154,907 W 54 % -4,439,768 W -24 Low mid 154,907 W 154,907 W ~ 126,680 W 30 % -2,485,703 W -16 low price 126,680 W 126,680 W ~ 0 W 6 % -531,638 W -4 Stock price rise probability score A Sector 47.1 46.8 48.1 43.5 46.6 43.6 57.4B Sector 28.8 40.0 34.2 43.5 30.0 34.2 Total average 2020.07.21 2020.08.19 2020.09.16 2020.10.20 2020.11.17 2020.12.15 37.9 43.4 41.1 35.0 38.3 38.9 9 % 2 % 2020.08.19 2020.09.16 2020.10.20 2020.11.17 2020.12.15 Total of increase rate Total score A Sector -1 % 3 % -10 % 7 % -7 % -0 % 47.0B Sector 28 % -17 % 21 % -45 % 12 % Total average 13 % -5 % -17 % 47 47 48 44 47 44 29 40 34 44 30 34 38 43 41 35 38 39 0 10 20 30 40 50 60 2020.07.21 2020.08.19 2020.09.16 2020.10.20 2020.11.17 2020.12.15 Stock price rise probability score A sector B sector Total average -1% 3% -10% 7% -7% 28% -17% 21% -45% 12%13% -5% -17% 9% 2% -60% -40% -20% 0% 20% 40% 2020.08.19 2020.09.16 2020.10.20 2020.11.17 2020.12.15 Increase rate of stock price rise A sector B sector Total average chong kun dang holdings
- 3. 정보와 완전 정보 결 투자판단 있습니 위배 무단으 숙지하 Compliance notice ① The information provided by The Algorithm Company Analysis Consulting is obtained through reliable data and information and The Algorithm Company Analysis Program (TACAP), but its accuracy or completeness are not guaranteed. Furthermore, it may change over time.Therefore, we are not legally responsible for the results of the data provided by The Algorithm Company Analysis Consulting because of information errors or omissions. ② The Algorithm Company Analysis Consulting and all the information provided on it site are reference materials for investment decisions and the final responsibility of investment is up to users utilizing this information. ③ The Algorithm Company Analysis Consulting and its site do not do anything that violates the related laws such as discretionary transaction. ④ Users can not reallocate and recycle the information provided by The Algorithm Company Analysis Consulting firm let alone the information provided by its Site. ⑤ Be sure to know about application period of this algorithm analysis report in order to improve its accuracy. Tel : 070 - 4667 - 5009 Email : tacac@tacac.co.kr Homepage : tacac.co.kr Blog : tacac.blog.me SERVICES M&A, IPO, RECOVER, CORPORATE RESTRUCTURING, MANAGEMENT OF TECHNOLOGY, BUSINESS STRATEGY, FAMILY BUSINESS Request : http://tacac.co.kr/?page_id=1374 ① Consulting is o The Algorithm accuracy or com change over tim results of the d Consulting bec ② information pr investment dec up ③ do anything th transaction. ④ The Algorithm information pr ⑤ analysis report