Performance and Financial Analysis of Algorithm Company
•
1 like•182 views

samsung electronics 005930 Algorithm Investment Report
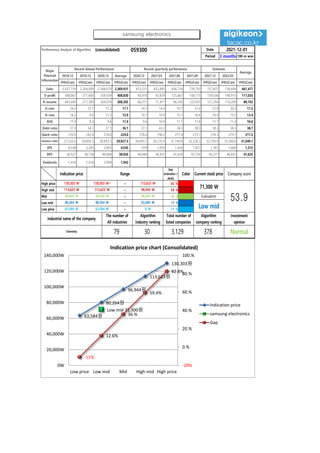
![[Price for scheduled purchasing]
Arbitrarily made
Algorithm stocks Trading Strategies (consolidated) 059300 Date
Period
Gap
(Indication /
stock)
Color
low price 63,584 W 63,584 W ~ 0 W -11 % 415,041 W 7
Low mid 80,264 W 80,264 W ~ 63,584 W 13 % -482,196 W -6
Mid 96,944 W 96,944 W ~ 80,264 W 36 % -1,379,432 W -14
High mid 113,623 W 113,623 W ~ 96,944 W 59 % -2,276,669 W -20
Suggested Purchase
Amount 3,835,403 W
Number of stocks
purchased 54
Indication price Range Buying / Selling Buying / Selling [Stocks]
High price 130,303 W 130,303 W~ ~ 113,623 W 83 % -3,173,906 W -24
2021-12-01
3 months
Current stock price Evaluation
Stock price rise
probability score
Investment opinion Prospective purchase amount
71,300 W Low mid 42.1 Normal 8,800,000 W
38.1 42.9 28.0 38.3 39.8 43.8
2021.07.05 2021.08.02 2021.08.31 2021.10.01 2021.11.02 2021.11.30
Stock price rise
probability score
A Sector 49.1 42.5 43.2 45.3 50.0 53.3
42.1
B Sector 27.1 43.3 12.9 45.3 29.6 34.2
Total average
2021.08.31 2021.10.01 2021.11.02 2021.11.30
Total of
increase rate
Total score
A Sector -15 % 1 % 5 % 9 % 6 %
-0 % 48.0
B Sector 38 % -235 % 71 % -53 % 13 %
Total average 11 % -53 % 27 % 4 % 9 %
2021.08.02
49
43 43 45
50
53
27
43
13
45
30
34
38
43
28
38 40
44
0
10
20
30
40
50
60
2021.07.05 2021.08.02 2021.08.31 2021.10.01 2021.11.02 2021.11.30
Stock price rise probability score
A sector
B sector
Total average
-15%
1% 5% 9% 6%
38%
-235%
71%
-53%
13%
11%
-53%
27%
4% 9%
-300%
-250%
-200%
-150%
-100%
-50%
0%
50%
100%
2021.08.02 2021.08.31 2021.10.01 2021.11.02 2021.11.30
Increase rate of stock price rise
A sector
B sector
Total average
samsung electronics](data:image/gif;base64,R0lGODlhAQABAIAAAAAAAP///yH5BAEAAAAALAAAAAABAAEAAAIBRAA7)
Recommended
Recommended
More Related Content
What's hot
What's hot (20)
Similar to Performance and Financial Analysis of Algorithm Company
Similar to Performance and Financial Analysis of Algorithm Company (20)
More from 알고리즘 기업분석 컨설팅-알기컨,algikeon
More from 알고리즘 기업분석 컨설팅-알기컨,algikeon (20)
Recently uploaded
Recently uploaded (20)
Performance and Financial Analysis of Algorithm Company
- 1. Performance Analysis of Algorithm (consolidated) 059300 Date Period 3 months 100-m won 2018.12 2019.12 2020.12 Average 2020.12 2021.03 2021.06 2021.09 2021.12 2022.03 IFRS(Con) IFRS(Con) IFRS(Con) IFRS(Con) IFRS(Con) IFRS(Con) IFRS(Con) IFRS(Con) IFRS(Con) IFRS(Con) IFRS(Con) Sales 2,437,714 2,304,009 2,368,070 2,369,931 615,515 653,885 636,716 739,792 757,837 738,694 661,477 O-profit 588,867 277,685 359,939 408,830 90,470 93,829 125,667 158,175 159,036 148,915 117,035 N-income 443,449 217,389 264,078 308,305 66,071 71,417 96,345 122,933 121,294 114,200 89,192 O-rate 24.2 12.1 15.2 17.1 14.7 14.3 19.7 21.4 21.0 20.2 17.5 N-rate 18.2 9.4 11.2 12.9 10.7 10.9 15.1 16.6 16.0 15.5 13.4 ROE 17.9 8.3 9.6 11.9 9.6 10.0 11.1 11.8 11.7 11.4 10.6 Debt-ratio 37.0 34.1 37.1 36.1 37.1 43.2 36.3 38.3 38.3 38.3 38.7 Quick-ratio 210.9 242.4 218.6 224.0 218.6 196.2 217.4 213.7 216.3 219.7 211.5 reserve-ratio 27,532.4 28,856.5 30,693.3 29,027.4 30,693.3 30,135.9 31,140.8 32,226.3 32,759.0 33,300.6 31,049.1 EPS 6,538 3,205 3,893 4,545 974 1,053 1,420 1,812 1,761 1,666 1,315 BPS 36,527 38,758 40,684 38,656 40,684 40,437 41,624 43,754 45,277 46,853 41,625 Dividends 1,416 1,416 2,994 1,942 Major Financial Information Recent Annual Performance Recent quarterly performance Estimate Average 2021-12-01 Gap (Indication / stock) Color High price ~ 83 % High mid ~ 59 % Mid ~ 36 % Low mid ~ 13 % Low price ~ -11 % Normal 63,584 W 63,584 W 0 W Industrial name of the company The number of All industries Algorithm Industry ranking Total number of listed companies Algorithm company ranking Investment opinion Chemistry 79 30 3,129 378 113,623 W 113,623 W 96,944 W 96,944 W 96,944 W 80,264 W Evaluation 130,303 W 130,303 W~ 113,623 W 71,300 W 53.9 80,264 W 80,264 W 63,584 W Low mid Indication price Range Current stock price Company score 63,584원 80,264원 96,944원 113,623원 130,303원 Low mid 71,300원 -11% 12.6% 36.% 59.4% 82.8% -20% 0.% 20.% 40.% 60.% 80.% 100.% 0W 20,000W 40,000W 60,000W 80,000W 100,000W 120,000W 140,000W Low price Low mid Mid High mid High price Indication price chart (Consolidated) Indication price samsung electronics Gap samsung electronics
- 2. [Price for scheduled purchasing] Arbitrarily made Algorithm stocks Trading Strategies (consolidated) 059300 Date Period Gap (Indication / stock) Color low price 63,584 W 63,584 W ~ 0 W -11 % 415,041 W 7 Low mid 80,264 W 80,264 W ~ 63,584 W 13 % -482,196 W -6 Mid 96,944 W 96,944 W ~ 80,264 W 36 % -1,379,432 W -14 High mid 113,623 W 113,623 W ~ 96,944 W 59 % -2,276,669 W -20 Suggested Purchase Amount 3,835,403 W Number of stocks purchased 54 Indication price Range Buying / Selling Buying / Selling [Stocks] High price 130,303 W 130,303 W~ ~ 113,623 W 83 % -3,173,906 W -24 2021-12-01 3 months Current stock price Evaluation Stock price rise probability score Investment opinion Prospective purchase amount 71,300 W Low mid 42.1 Normal 8,800,000 W 38.1 42.9 28.0 38.3 39.8 43.8 2021.07.05 2021.08.02 2021.08.31 2021.10.01 2021.11.02 2021.11.30 Stock price rise probability score A Sector 49.1 42.5 43.2 45.3 50.0 53.3 42.1 B Sector 27.1 43.3 12.9 45.3 29.6 34.2 Total average 2021.08.31 2021.10.01 2021.11.02 2021.11.30 Total of increase rate Total score A Sector -15 % 1 % 5 % 9 % 6 % -0 % 48.0 B Sector 38 % -235 % 71 % -53 % 13 % Total average 11 % -53 % 27 % 4 % 9 % 2021.08.02 49 43 43 45 50 53 27 43 13 45 30 34 38 43 28 38 40 44 0 10 20 30 40 50 60 2021.07.05 2021.08.02 2021.08.31 2021.10.01 2021.11.02 2021.11.30 Stock price rise probability score A sector B sector Total average -15% 1% 5% 9% 6% 38% -235% 71% -53% 13% 11% -53% 27% 4% 9% -300% -250% -200% -150% -100% -50% 0% 50% 100% 2021.08.02 2021.08.31 2021.10.01 2021.11.02 2021.11.30 Increase rate of stock price rise A sector B sector Total average samsung electronics
- 3. 정보와 완전 정보 결 투자판단 있습니 위배 무단으 숙지하 Compliance notice ① The information provided by The Algorithm Company Analysis Consulting is obtained through reliable data and information and The Algorithm Company Analysis Program (TACAP), but its accuracy or completeness are not guaranteed. Furthermore, it may change over time.Therefore, we are not legally responsible for the results of the data provided by The Algorithm Company Analysis Consulting because of information errors or omissions. ② The Algorithm Company Analysis Consulting and all the information provided on it site are reference materials for investment decisions and the final responsibility of investment is up to users utilizing this information. ③ The Algorithm Company Analysis Consulting and its site do not do anything that violates the related laws such as discretionary transaction. ④ Users can not reallocate and recycle the information provided by The Algorithm Company Analysis Consulting firm let alone the information provided by its Site. ⑤ Be sure to know about application period of this algorithm analysis report in order to improve its accuracy. Tel : 070 - 4667 - 5009 Email : tacac@tacac.co.kr Homepage : tacac.co.kr Blog : tacac.blog.me SERVICES M&A, IPO, RECOVER, CORPORATE RESTRUCTURING, MANAGEMENT OF TECHNOLOGY, BUSINESS STRATEGY, FAMILY BUSINESS Request : http://tacac.co.kr/?page_id=1374 ① Consulting is o The Algorithm accuracy or com change over tim results of the d Consulting bec ② information pr investment dec up ③ do anything th transaction. ④ The Algorithm information pr ⑤ analysis report