e-mart 139480 Algorithm Investment Report
•
0 likes•5 views

e-mart 139480 Algorithm Investment Report
![[Price for scheduled purchasing]
Arbitrarily made
Algorithm stocks Trading Strategies (consolidated) 139480 Date
Period
Gap
(Indication /
stock)
Color
low price 164,594 W 164,594 W ~ 0 W 107 % -5,023,692 W All selling
Low mid 182,169 W 182,169 W ~ 164,594 W 129 % -6,062,490 W All selling
Mid 199,744 W 199,744 W ~ 182,169 W 151 % -7,101,288 W All selling
High mid 217,319 W 217,319 W ~ 199,744 W 173 % -8,140,086 W All selling
Suggested Purchase
Amount 4,704,883 W
Number of stocks
purchased 59
Indication price Range Buying / Selling Buying / Selling [Stocks]
High price 234,894 W 234,894 W~ ~ 217,319 W 195 % -9,178,884 W All selling
2023-08-14
3 months
Current stock price Evaluation
Stock price rise
probability score
Investment opinion Prospective purchase amount
79,600 W Low price 41.4 Normal 10,000,000 W
38.5 36.7 36.7 37.5 41.9 47.2
2023.03.20 2023.04.17 2023.05.17 2023.06.16 2023.07.14 2023.08.11
Stock price rise
probability score
A Sector 47.9 43.0 42.9 45.3 42.5 48.9
41.4
B Sector 29.2 30.4 30.4 45.3 41.3 45.4
Total average
2023.05.17 2023.06.16 2023.07.14 2023.08.11
Total of
increase rate
Total score
A Sector -11 % -0 % 5 % -6 % 13 %
4 % 51.3
B Sector 4 % 0 % 33 % -10 % 9 %
Total average -5 % -0 % 2 % 10 % 11 %
2023.04.17
48
43 43 45
43
49
29 30 30
45
41
45
39 37 37 38
42
47
0
10
20
30
40
50
60
2023.03.20 2023.04.17 2023.05.17 2023.06.16 2023.07.14 2023.08.11
Stock price rise probability score
A sector
B sector
Total average
-11%
-0%
5%
-6%
13%
4%
0%
33%
-10%
9%
-5%
-0%
2%
10% 11%
-20%
-10%
0%
10%
20%
30%
40%
2023.04.17 2023.05.17 2023.06.16 2023.07.14 2023.08.11
Increase rate of stock price rise
A sector
B sector
Total average
e-mart](data:image/gif;base64,R0lGODlhAQABAIAAAAAAAP///yH5BAEAAAAALAAAAAABAAEAAAIBRAA7)
Recommended
Recommended
More Related Content
Similar to e-mart 139480 Algorithm Investment Report
Similar to e-mart 139480 Algorithm Investment Report (20)
More from 알고리즘 기업분석 컨설팅-알기컨,algikeon
More from 알고리즘 기업분석 컨설팅-알기컨,algikeon (20)
Recently uploaded
Recently uploaded (20)
e-mart 139480 Algorithm Investment Report
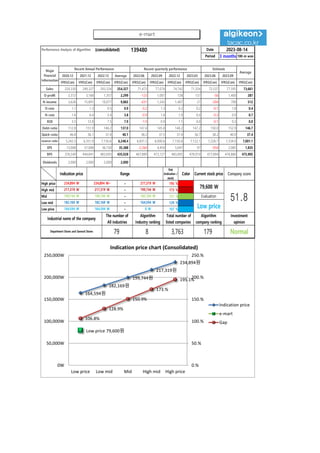
- 1. Performance Analysis of Algorithm (consolidated) 139480 Date Period 3 months 100-m won 2020.12 2021.12 2022.12 Average 2022.06 2022.09 2022.12 2023.03 2023.06 2023.09 IFRS(Con) IFRS(Con) IFRS(Con) IFRS(Con) IFRS(Con) IFRS(Con) IFRS(Con) IFRS(Con) IFRS(Con) IFRS(Con) IFRS(Con) Sales 220,330 249,327 293,324 254,327 71,473 77,074 74,742 71,354 72,537 77,595 73,661 O-profit 2,372 3,168 1,357 2,299 -123 1,007 128 137 -56 1,400 287 N-income 3,626 15,891 10,077 9,865 -631 1,243 1,407 27 -204 708 512 O-rate 1.1 1.3 0.5 0.9 -0.2 1.3 0.2 0.2 -0.1 1.8 0.4 N-rate 1.6 6.4 3.4 3.8 -0.9 1.6 1.9 0.0 -0.3 0.9 0.7 ROE 3.5 12.8 7.5 7.9 -1.9 0.9 1.1 0.0 -0.1 0.3 0.0 Debt-ratio 112.8 151.9 146.2 137.0 147.4 145.8 146.2 147.2 150.0 152.9 146.7 Quick-ratio 46.8 36.1 37.4 40.1 38.2 37.5 37.4 36.7 38.2 40.9 37.4 reserve-ratio 5,242.5 6,351.9 7,150.6 6,248.4 6,831.3 6,900.6 7,150.6 7,122.1 7,226.7 7,334.0 7,001.1 EPS 13,008 57,006 36,150 35,388 -2,264 4,459 5,047 97 -954 2,085 1,835 BPS 376,549 444,841 483,695 435,028 467,889 473,127 483,695 478,910 477,894 476,880 475,905 Dividends 2,000 2,000 2,000 2,000 Major Financial Information Recent Annual Performance Recent quarterly performance Estimate Average 2023-08-14 Gap (Indication / stock) Color High price ~ 195 % High mid ~ 173 % Mid ~ 151 % Low mid ~ 129 % Low price ~ 107 % Normal 164,594 W 164,594 W 0 W Industrial name of the company The number of All industries Algorithm Industry ranking Total number of listed companies Algorithm company ranking Investment opinion Department Stores and General Stores 79 8 3,763 179 217,319 W 217,319 W 199,744 W 199,744 W 199,744 W 182,169 W Evaluation 234,894 W 234,894 W~ 217,319 W 79,600 W 51.8 182,169 W 182,169 W 164,594 W Low price Indication price Range Current stock price Company score 164,594원 182,169원 199,744원 217,319원 234,894원 Low price 79,600원 106.8% 128.9% 150.9% 173.% 195.1% 0.% 50.% 100.% 150.% 200.% 250.% 0W 50,000W 100,000W 150,000W 200,000W 250,000W Low price Low mid Mid High mid High price Indication price chart (Consolidated) Indication price e-mart Gap e-mart
- 2. [Price for scheduled purchasing] Arbitrarily made Algorithm stocks Trading Strategies (consolidated) 139480 Date Period Gap (Indication / stock) Color low price 164,594 W 164,594 W ~ 0 W 107 % -5,023,692 W All selling Low mid 182,169 W 182,169 W ~ 164,594 W 129 % -6,062,490 W All selling Mid 199,744 W 199,744 W ~ 182,169 W 151 % -7,101,288 W All selling High mid 217,319 W 217,319 W ~ 199,744 W 173 % -8,140,086 W All selling Suggested Purchase Amount 4,704,883 W Number of stocks purchased 59 Indication price Range Buying / Selling Buying / Selling [Stocks] High price 234,894 W 234,894 W~ ~ 217,319 W 195 % -9,178,884 W All selling 2023-08-14 3 months Current stock price Evaluation Stock price rise probability score Investment opinion Prospective purchase amount 79,600 W Low price 41.4 Normal 10,000,000 W 38.5 36.7 36.7 37.5 41.9 47.2 2023.03.20 2023.04.17 2023.05.17 2023.06.16 2023.07.14 2023.08.11 Stock price rise probability score A Sector 47.9 43.0 42.9 45.3 42.5 48.9 41.4 B Sector 29.2 30.4 30.4 45.3 41.3 45.4 Total average 2023.05.17 2023.06.16 2023.07.14 2023.08.11 Total of increase rate Total score A Sector -11 % -0 % 5 % -6 % 13 % 4 % 51.3 B Sector 4 % 0 % 33 % -10 % 9 % Total average -5 % -0 % 2 % 10 % 11 % 2023.04.17 48 43 43 45 43 49 29 30 30 45 41 45 39 37 37 38 42 47 0 10 20 30 40 50 60 2023.03.20 2023.04.17 2023.05.17 2023.06.16 2023.07.14 2023.08.11 Stock price rise probability score A sector B sector Total average -11% -0% 5% -6% 13% 4% 0% 33% -10% 9% -5% -0% 2% 10% 11% -20% -10% 0% 10% 20% 30% 40% 2023.04.17 2023.05.17 2023.06.16 2023.07.14 2023.08.11 Increase rate of stock price rise A sector B sector Total average e-mart
- 3. 정보와 완전 정보 결 투자판단 있습니 위배 무단으 숙지하 Compliance notice ① The information provided by The Algorithm Company Analysis Consulting is obtained through reliable data and information and The Algorithm Company Analysis Program (TACAP), but its accuracy or completeness are not guaranteed. Furthermore, it may change over time.Therefore, we are not legally responsible for the results of the data provided by The Algorithm Company Analysis Consulting because of information errors or omissions. ② The Algorithm Company Analysis Consulting and all the information provided on it site are reference materials for investment decisions and the final responsibility of investment is up to users utilizing this information. ③ The Algorithm Company Analysis Consulting and its site do not do anything that violates the related laws such as discretionary transaction. ④ Users can not reallocate and recycle the information provided by The Algorithm Company Analysis Consulting firm let alone the information provided by its Site. ⑤ Be sure to know about application period of this algorithm analysis report in order to improve its accuracy. Tel : 070 - 4667 - 5009 Email : tacac@tacac.co.kr Homepage : tacac.co.kr Blog : tacac.blog.me SERVICES M&A, IPO, RECOVER, CORPORATE RESTRUCTURING, MANAGEMENT OF TECHNOLOGY, BUSINESS STRATEGY, FAMILY BUSINESS Request : http://tacac.co.kr/?page_id=1374 ① Consulting is o The Algorithm accuracy or com change over tim results of the d Consulting bec ② information pr investment dec up ③ do anything th transaction. ④ The Algorithm information pr ⑤ analysis report