shinsegae enc 034300 Algorithm Investmenr Report
•
0 likes•57 views

shinsegae enc 034300 Algorithm Investmenr Report
![[Price for scheduled purchasing]
Arbitrarily made
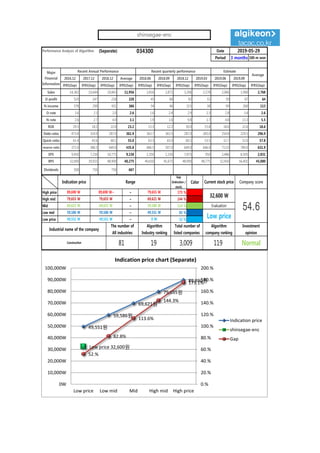
Algorithm stocks Trading Strategies (Separate) 034300 Date
Period
Gap
(Indication /
stock)
Color
2019-05-29
3 months
Current stock price Evaluation
Stock price rise
probability score
Investment opinion Prospective purchase amount
32,600 W Low price 59.0 Normal 7,000,000 W
Suggested Purchase
Amount 3,724,653 W
Number of stocks
purchased 114
Indication price Range Buying / Selling Buying / Selling [Stocks]
High price 89,690 W 89,690 W~ ~ 79,655 W 175 % -6,522,738 W All selling
High mid 79,655 W 79,655 W ~ 69,621 W 144 % -5,376,236 W All selling
Mid 69,621 W 69,621 W ~ 59,586 W 114 % -4,229,735 W All selling
Low mid 59,586 W 59,586 W ~ 49,551 W 83 % -3,083,233 W -52
low price 49,551 W 49,551 W ~ 0 W 52 % -1,936,731 W -39
2018.12.27 2019.01.28 2019.02.28 2019.03.29 2019.04.26 2019.05.28
47.5 39.3 37.5
Stock price rise
probability score
A Sector 46.1 49.2 48.9 49.6 42.0 45.1
59.0B Sector 27.9 45.4 49.6 49.6 36.7 30.0
Total average 37.0 47.3 45.1
-21 % -5 %
2019.01.28 2019.02.28 2019.03.29 2019.04.26 2019.05.28
Total of
increase rate
Total score
A Sector 6 % -1 % 1 % -18 % 7 %
-1 % 46.0B Sector 39 % -10 % 17 % -35 % -22 %
Total average 22 % -5 % 5 %
6%
-1% 1%
-18%
7%
39%
-10%
17%
-35%
-22%
22%
-5%
5%
-21%
-5%
-40%
-20%
0%
20%
40%
60%
2019.01.28 2019.02.28 2019.03.29 2019.04.26 2019.05.28
Increase rate of stock price rise
A sector
B sector
Total average
shinsegae-enc
46
49 49 50
42
45
28
45
41
50
37
30
37
47 45 48
39 38
0
10
20
30
40
50
60
2018.12.27 2019.01.28 2019.02.28 2019.03.29 2019.04.26 2019.05.28
Stock price rise probability score
A sector
B sector
Total average](data:image/gif;base64,R0lGODlhAQABAIAAAAAAAP///yH5BAEAAAAALAAAAAABAAEAAAIBRAA7)
Recommended
Recommended
More Related Content
What's hot
What's hot (20)
Similar to shinsegae enc 034300 Algorithm Investmenr Report
Similar to shinsegae enc 034300 Algorithm Investmenr Report (20)
More from 알고리즘 기업분석 컨설팅-알기컨,algikeon
More from 알고리즘 기업분석 컨설팅-알기컨,algikeon (20)
Recently uploaded
Recently uploaded (20)
shinsegae enc 034300 Algorithm Investmenr Report
- 1. Performance Analysis of Algorithm (Separate) 034300 Date Period 3 months 100-m won 2016.12 2017.12 2018.12 Average 2018.06 2018.09 2018.12 2019.03 2019.06 2019.09 IFRS(Sep) IFRS(Sep) IFRS(Sep) IFRS(Sep) IFRS(Sep) IFRS(Sep) IFRS(Sep) IFRS(Sep) IFRS(Sep) IFRS(Sep) IFRS(Sep) Sales 14,382 10,644 10,843 11,956 2,816 2,871 3,206 2,178 2,066 1,960 2,768 O-profit 519 247 218 328 45 68 92 51 59 67 64 N-income 378 290 431 366 54 46 315 38 99 260 113 O-rate 3.6 2.3 2.0 2.6 1.6 2.4 2.9 2.3 2.8 3.4 2.6 N-rate 2.6 2.7 4.0 3.1 1.9 1.6 9.8 1.7 4.8 13.3 5.5 ROE 29.5 18.2 22.0 23.2 13.3 12.2 30.0 15.8 18.0 22.6 18.6 Debt-ratio 473.8 324.9 287.0 361.9 363.7 363.5 287.0 283.0 254.8 229.5 296.9 Quick-ratio 61.4 43.6 60.1 55.0 63.3 65.0 60.1 53.5 52.7 52.0 57.8 reserve-ratio 272.0 386.5 649.0 435.8 486.5 507.0 649.0 646.0 713.9 789.0 631.9 EPS 9,450 7,250 10,775 9,158 1,350 1,150 7,875 950 2,486 6,505 2,831 BPS 32,000 39,925 48,900 40,275 40,650 41,675 48,900 48,775 52,450 56,401 45,000 Dividends 500 750 750 667 2019-05-29 Major Financial Information Recent Annual Performance Recent quarterly performance Estimate Average Gap (Indication / stock) Color High price ~ 175 % High mid ~ 144 % Mid ~ 114 % Low mid ~ 83 % Low price ~ 52 % Indication price Range Current stock price Company score 79,655 W 79,655 W 69,621 W 69,621 W 69,621 W 59,586 W Evaluation 89,690 W 89,690 W~ 79,655 W 32,600 W 54.659,586 W 59,586 W 49,551 W Low price Normal 49,551 W 49,551 W 0 W Industrial name of the company The number of All industries Algorithm Industry ranking Total number of listed companies Algorithm company ranking Investment opinion Construction 81 19 3,009 119 49,551원 59,586원 69,621원 79,655원 89,690원 Low price 32,600원 52.% 82.8% 113.6% 144.3% 175.1% 0.% 20.% 40.% 60.% 80.% 100.% 120.% 140.% 160.% 180.% 200.% 0W 10,000W 20,000W 30,000W 40,000W 50,000W 60,000W 70,000W 80,000W 90,000W 100,000W Low price Low mid Mid High mid High price Indication price chart (Separate) Indication price shinsegae-enc Gap shinsegae-enc
- 2. [Price for scheduled purchasing] Arbitrarily made Algorithm stocks Trading Strategies (Separate) 034300 Date Period Gap (Indication / stock) Color 2019-05-29 3 months Current stock price Evaluation Stock price rise probability score Investment opinion Prospective purchase amount 32,600 W Low price 59.0 Normal 7,000,000 W Suggested Purchase Amount 3,724,653 W Number of stocks purchased 114 Indication price Range Buying / Selling Buying / Selling [Stocks] High price 89,690 W 89,690 W~ ~ 79,655 W 175 % -6,522,738 W All selling High mid 79,655 W 79,655 W ~ 69,621 W 144 % -5,376,236 W All selling Mid 69,621 W 69,621 W ~ 59,586 W 114 % -4,229,735 W All selling Low mid 59,586 W 59,586 W ~ 49,551 W 83 % -3,083,233 W -52 low price 49,551 W 49,551 W ~ 0 W 52 % -1,936,731 W -39 2018.12.27 2019.01.28 2019.02.28 2019.03.29 2019.04.26 2019.05.28 47.5 39.3 37.5 Stock price rise probability score A Sector 46.1 49.2 48.9 49.6 42.0 45.1 59.0B Sector 27.9 45.4 49.6 49.6 36.7 30.0 Total average 37.0 47.3 45.1 -21 % -5 % 2019.01.28 2019.02.28 2019.03.29 2019.04.26 2019.05.28 Total of increase rate Total score A Sector 6 % -1 % 1 % -18 % 7 % -1 % 46.0B Sector 39 % -10 % 17 % -35 % -22 % Total average 22 % -5 % 5 % 6% -1% 1% -18% 7% 39% -10% 17% -35% -22% 22% -5% 5% -21% -5% -40% -20% 0% 20% 40% 60% 2019.01.28 2019.02.28 2019.03.29 2019.04.26 2019.05.28 Increase rate of stock price rise A sector B sector Total average shinsegae-enc 46 49 49 50 42 45 28 45 41 50 37 30 37 47 45 48 39 38 0 10 20 30 40 50 60 2018.12.27 2019.01.28 2019.02.28 2019.03.29 2019.04.26 2019.05.28 Stock price rise probability score A sector B sector Total average
- 3. may ded by Compliance notice ① The information provided by The Algorithm Company Analysis Consulting is obtained through reliable data and information and The Algorithm Company Analysis Program (TACAP), but its accuracy or completeness are not guaranteed. Furthermore, it may change over time.Therefore, we are not legally responsible for the results of the data provided by The Algorithm Company Analysis Consulting because of information errors or omissions. ② The Algorithm Company Analysis Consulting and all the information provided on it site are reference materials for investment decisions and the final responsibility of investment is up to users utilizing this information. ③ The Algorithm Company Analysis Consulting and its site do not do anything that violates the related laws such as discretionary transaction. ④ Users can not reallocate and recycle the information provided by The Algorithm Company Analysis Consulting firm let alone the information provided by its Site. ⑤ Be sure to know about application period of this algorithm analysis report in order to improve its accuracy. Tel : 070 - 4667 - 5009 Email : tacac@tacac.co.kr Homepage : tacac.co.kr Blog : tacac.blog.me SERVICES EDUCATION, M&A, IPO, RECOVER, CORPORATE RESTRUCTURING, MANAGEMENT OF TECHNOLOGY, BUSINESS STRATEGY, FAMILY BUSINESS Request : http://tacac.co.kr/?page_id=1374