ncsoft 036570 Algorithm Investment Report
•
1 like•184 views

ncsoft 036570 Algorithm Investment Report
![[Price for scheduled purchasing]
Arbitrarily made
Algorithm stocks Trading Strategies (consolidated) 036570 Date
Period
Gap
(Indication /
stock)
Color
2021-08-11
3 months
Current stock price Evaluation
Stock price rise
probability score
Investment opinion Prospective purchase amount
810,000 W High mid 38.1 Normal 3,000,000 W
Suggested Purchase
Amount 1,115,364 W
Number of stocks
purchased 1
Indication price Range Buying / Selling Buying / Selling [Stocks]
High price 1,036,113 W 1,036,113 W~ ~ 897,551 W 28 % -311,356 W -0
High mid 897,551 W 897,551 W ~ 758,989 W 11 % -120,557 W -0
Mid 758,989 W 758,989 W ~ 620,427 W -6 % 70,242 W 0
Low mid 620,427 W 620,427 W ~ 481,865 W -23 % 261,041 W 0
low price 481,865 W 481,865 W ~ 0 W -41 % 451,840 W 1
Stock price rise
probability score
A Sector 45.7 47.3 48.8 45.4 47.8 45.8
38.1
B Sector 24.2 32.1 25.4 45.4 19.2 20.4
Total average
2021.03.19 2021.04.16 2021.05.17 2021.06.15 2021.07.13 2021.08.10
34.9 39.7 37.1 26.3 33.5 33.1
22 % -1 %
2021.04.16 2021.05.17 2021.06.15 2021.07.13 2021.08.10
Total of
increase rate
Total score
A Sector 3 % 3 % -8 % 5 % -4 %
-3 % 46.3
B Sector 25 % -26 % 44 % -137 % 6 %
Total average 12 % -7 % -41 %
46 47 49
45 48 46
24
32
25
45
19 20
35
40 37
26
33 33
0
10
20
30
40
50
60
2021.03.19 2021.04.16 2021.05.17 2021.06.15 2021.07.13 2021.08.10
Stock price rise probability score
A sector
B sector
Total average
3% 3%
-8%
5% -4%
25%
-26%
44%
-137%
6%
12%
-7%
-41%
22%
-1%
-150%
-100%
-50%
0%
50%
100%
2021.04.16 2021.05.17 2021.06.15 2021.07.13 2021.08.10
Increase rate of stock price rise
A sector
B sector
Total average
nc soft](data:image/gif;base64,R0lGODlhAQABAIAAAAAAAP///yH5BAEAAAAALAAAAAABAAEAAAIBRAA7)
Recommended
Recommended
More Related Content
What's hot
What's hot (20)
Similar to ncsoft 036570 Algorithm Investment Report
Similar to ncsoft 036570 Algorithm Investment Report (20)
More from 알고리즘 기업분석 컨설팅-알기컨,algikeon
More from 알고리즘 기업분석 컨설팅-알기컨,algikeon (20)
Recently uploaded
Recently uploaded (20)
ncsoft 036570 Algorithm Investment Report
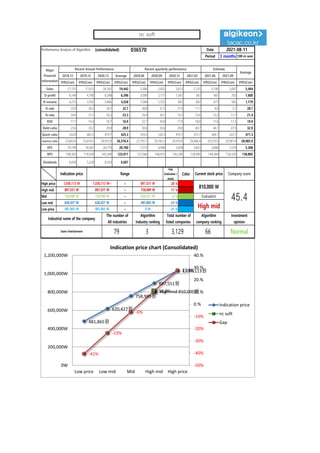
- 1. Performance Analysis of Algorithm (consolidated) 036570 Date Period 3 months 100-m won 2018.12 2019.12 2020.12 Average 2020.06 2020.09 2020.12 2021.03 2021.06 2021.09 IFRS(Con) IFRS(Con) IFRS(Con) IFRS(Con) IFRS(Con) IFRS(Con) IFRS(Con) IFRS(Con) IFRS(Con) IFRS(Con) IFRS(Con) Sales 17,151 17,012 24,162 19,442 5,386 5,852 5,613 5,125 5,106 5,087 5,494 O-profit 6,149 4,790 8,248 6,396 2,090 2,177 1,567 567 407 292 1,600 N-income 4,215 3,592 5,866 4,558 1,584 1,525 803 802 673 565 1,179 O-rate 35.9 28.2 34.1 32.7 38.8 37.2 27.9 11.1 8.0 5.7 28.7 N-rate 24.6 21.1 24.3 23.3 29.4 26.1 14.3 15.6 13.2 11.1 21.4 ROE 17.7 14.3 18.7 16.9 22.7 20.8 17.9 18.0 17.6 17.3 19.9 Debt-ratio 23.6 33.2 29.8 28.9 30.6 30.6 29.8 40.7 44.1 47.9 32.9 Quick-ratio 332.8 463.5 479.7 425.3 559.5 530.3 479.7 315.7 264.7 222.1 471.3 reserve-ratio 23,603.6 25,614.5 29,910.9 26,376.4 27,792.7 29,165.5 29,910.9 29,066.4 29,519.9 29,981.8 28,983.9 EPS 19,199 16,361 26,719 20,760 7,215 6,946 3,658 3,653 3,066 2,574 5,368 BPS 108,363 114,430 143,240 122,011 127,066 146,415 143,240 138,499 144,384 150,520 138,805 Dividends 6,050 5,220 8,550 6,607 2021-08-11 Major Financial Information Recent Annual Performance Recent quarterly performance Estimate Average Gap (Indication / stock) Color High price ~ 28 % High mid ~ 11 % Mid ~ -6 % Low mid ~ -23 % Low price ~ -41 % Indication price Range Current stock price Company score 897,551 W 897,551 W 758,989 W 758,989 W 758,989 W 620,427 W Evaluation 1,036,113 W 1,036,113 W~ 897,551 W 810,000 W 45.4 620,427 W 620,427 W 481,865 W High mid Normal 481,865 W 481,865 W 0 W Industrial name of the company The number of All industries Algorithm Industry ranking Total number of listed companies Algorithm company ranking Investment opinion Game Entertainment 79 3 3,129 66 481,865원 620,427원 758,989원 897,551원 1,036,113원 High mid 810,000원 -41% -23% -6% 10.8% 27.9% -50% -40% -30% -20% -10% 0.% 10.% 20.% 30.% 40.% 0W 200,000W 400,000W 600,000W 800,000W 1,000,000W 1,200,000W Low price Low mid Mid High mid High price Indication price chart (Consolidated) Indication price nc soft Gap nc soft
- 2. [Price for scheduled purchasing] Arbitrarily made Algorithm stocks Trading Strategies (consolidated) 036570 Date Period Gap (Indication / stock) Color 2021-08-11 3 months Current stock price Evaluation Stock price rise probability score Investment opinion Prospective purchase amount 810,000 W High mid 38.1 Normal 3,000,000 W Suggested Purchase Amount 1,115,364 W Number of stocks purchased 1 Indication price Range Buying / Selling Buying / Selling [Stocks] High price 1,036,113 W 1,036,113 W~ ~ 897,551 W 28 % -311,356 W -0 High mid 897,551 W 897,551 W ~ 758,989 W 11 % -120,557 W -0 Mid 758,989 W 758,989 W ~ 620,427 W -6 % 70,242 W 0 Low mid 620,427 W 620,427 W ~ 481,865 W -23 % 261,041 W 0 low price 481,865 W 481,865 W ~ 0 W -41 % 451,840 W 1 Stock price rise probability score A Sector 45.7 47.3 48.8 45.4 47.8 45.8 38.1 B Sector 24.2 32.1 25.4 45.4 19.2 20.4 Total average 2021.03.19 2021.04.16 2021.05.17 2021.06.15 2021.07.13 2021.08.10 34.9 39.7 37.1 26.3 33.5 33.1 22 % -1 % 2021.04.16 2021.05.17 2021.06.15 2021.07.13 2021.08.10 Total of increase rate Total score A Sector 3 % 3 % -8 % 5 % -4 % -3 % 46.3 B Sector 25 % -26 % 44 % -137 % 6 % Total average 12 % -7 % -41 % 46 47 49 45 48 46 24 32 25 45 19 20 35 40 37 26 33 33 0 10 20 30 40 50 60 2021.03.19 2021.04.16 2021.05.17 2021.06.15 2021.07.13 2021.08.10 Stock price rise probability score A sector B sector Total average 3% 3% -8% 5% -4% 25% -26% 44% -137% 6% 12% -7% -41% 22% -1% -150% -100% -50% 0% 50% 100% 2021.04.16 2021.05.17 2021.06.15 2021.07.13 2021.08.10 Increase rate of stock price rise A sector B sector Total average nc soft
- 3. 정보와 완전 정보 결 투자판단 있습니 위배 무단으 숙지하 Compliance notice ① The information provided by The Algorithm Company Analysis Consulting is obtained through reliable data and information and The Algorithm Company Analysis Program (TACAP), but its accuracy or completeness are not guaranteed. Furthermore, it may change over time.Therefore, we are not legally responsible for the results of the data provided by The Algorithm Company Analysis Consulting because of information errors or omissions. ② The Algorithm Company Analysis Consulting and all the information provided on it site are reference materials for investment decisions and the final responsibility of investment is up to users utilizing this information. ③ The Algorithm Company Analysis Consulting and its site do not do anything that violates the related laws such as discretionary transaction. ④ Users can not reallocate and recycle the information provided by The Algorithm Company Analysis Consulting firm let alone the information provided by its Site. ⑤ Be sure to know about application period of this algorithm analysis report in order to improve its accuracy. Tel : 070 - 4667 - 5009 Email : tacac@tacac.co.kr Homepage : tacac.co.kr Blog : tacac.blog.me SERVICES M&A, IPO, RECOVER, CORPORATE RESTRUCTURING, MANAGEMENT OF TECHNOLOGY, BUSINESS STRATEGY, FAMILY BUSINESS Request : http://tacac.co.kr/?page_id=1374 ① Consulting is o The Algorithm accuracy or com change over tim results of the d Consulting bec ② information pr investment dec up ③ do anything th transaction. ④ The Algorithm information pr ⑤ analysis report