soulbrain 036830 Algorithm Investment Report
•
0 likes•23 views

soulbrain 036830 Algorithm Investment Report
![[Price for scheduled purchasing]
Arbitrarily made
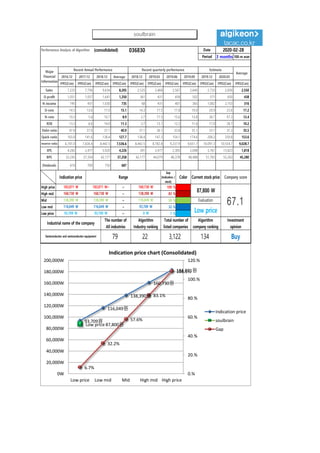
Algorithm stocks Trading Strategies (consolidated) 036830 Date
Period
Gap
(Indication /
stock)
Color
low price 93,709 W 93,709 W ~ 0 W 7 % -591,139 W -6
Low mid 116,049 W 116,049 W ~ 93,709 W 32 % -2,826,166 W -24
Mid 138,390 W 138,390 W ~ 116,049 W 58 % -5,061,193 W -37
High mid 160,730 W 160,730 W ~ 138,390 W 83 % -7,296,221 W -45
Suggested Purchase
Amount 8,783,841 W
Number of stocks
purchased 100
Indication price Range Buying / Selling Buying / Selling [Stocks]
High price 183,071 W 183,071 W~ ~ 160,730 W 109 % -9,531,248 W All selling
2020-02-28
3 months
Current stock price Evaluation
Stock price rise
probability score
Investment opinion Prospective purchase amount
87,800 W Low price 61.8 Buy 14,000,000 W
43.0 31.3 30.1 53.3 39.2 38.5
2019.10.01 2019.10.31 2019.11.28 2019.12.27 2020.01.30 2020.02.27
Stock price rise
probability score
A Sector 46.0 49.6 48.2 52.6 46.4 44.1
61.8B Sector 40.0 12.9 12.1 52.6 32.1 32.9
Total average
2019.11.28 2019.12.27 2020.01.30 2020.02.27
Total of
increase rate
Total score
A Sector 7 % -3 % 8 % -13 % -5 %
-7 % 41.3B Sector -210 % -7 % 77 % -64 % 3 %
Total average -37 % -4 % 44 % -36 % -2 %
2019.10.31
46
50 48
53
46 44
40
13 12
53
32 33
43
31 30
53
39 39
0
10
20
30
40
50
60
2019.10.01 2019.10.31 2019.11.28 2019.12.27 2020.01.30 2020.02.27
Stock price rise probability score
A sector
B sector
Total average
7% -3% 8%
-13% -5%
-210%
-7%
77%
-64%
3%
-37%
-4%
44%
-36%
-2%
-250%
-200%
-150%
-100%
-50%
0%
50%
100%
2019.10.31 2019.11.28 2019.12.27 2020.01.30 2020.02.27
Increase rate of stock price rise
A sector
B sector
Total average
soulbrain](data:image/gif;base64,R0lGODlhAQABAIAAAAAAAP///yH5BAEAAAAALAAAAAABAAEAAAIBRAA7)
Recommended
Recommended
More Related Content
What's hot
What's hot (20)
Similar to soulbrain 036830 Algorithm Investment Report
Similar to soulbrain 036830 Algorithm Investment Report (20)
More from 알고리즘 기업분석 컨설팅-알기컨,algikeon
More from 알고리즘 기업분석 컨설팅-알기컨,algikeon (20)
Recently uploaded
Recently uploaded (20)
soulbrain 036830 Algorithm Investment Report
- 1. Performance Analysis of Algorithm (consolidated) 036830 Date Period 3 months 100-m won 2016.12 2017.12 2018.12 Average 2018.12 2019.03 2019.06 2019.09 2019.12 2020.03 IFRS(Con) IFRS(Con) IFRS(Con) IFRS(Con) IFRS(Con) IFRS(Con) IFRS(Con) IFRS(Con) IFRS(Con) IFRS(Con) IFRS(Con) Sales 7,225 7,756 9,634 8,205 2,525 2,468 2,567 2,640 2,733 2,830 2,550 O-profit 1,051 1,057 1,641 1,250 361 431 458 502 571 650 438 N-income 745 431 1,030 735 68 431 401 365 1,002 2,753 316 O-rate 14.5 13.6 17.0 15.1 14.3 17.5 17.8 19.0 20.9 23.0 17.2 N-rate 10.3 5.6 10.7 8.9 2.7 17.5 15.6 13.8 36.7 97.3 12.4 ROE 13.3 6.6 14.0 11.3 3.7 13.1 12.2 11.6 17.0 28.7 10.2 Debt-ratio 47.8 37.9 37.1 40.9 37.1 36.1 33.8 35.1 33.1 31.3 35.5 Quick-ratio 103.0 141.6 138.4 127.7 138.4 147.3 154.1 174.6 208.2 250.8 153.6 reserve-ratio 6,741.0 7,426.4 8,442.5 7,536.6 8,442.5 8,782.8 9,237.9 9,651.7 10,091.3 10,554.7 9,028.7 EPS 4,282 2,477 5,920 4,226 391 2,477 2,305 2,098 5,761 15,823 1,818 BPS 32,245 37,354 42,177 37,258 42,177 44,079 46,378 48,488 51,765 55,263 45,280 Dividends 610 700 750 687 Major Financial Information Recent Annual Performance Recent quarterly performance Estimate Average 2020-02-28 Gap (Indication / stock) Color High price ~ 109 % High mid ~ 83 % Mid ~ 58 % Low mid ~ 32 % Low price ~ 7 % Buy 93,709 W 93,709 W 0 W Industrial name of the company The number of All industries Algorithm Industry ranking Total number of listed companies Algorithm company ranking Investment opinion Semiconductor and semiconductor equipment 79 22 3,122 134 160,730 W 160,730 W 138,390 W 138,390 W 138,390 W 116,049 W Evaluation 183,071 W 183,071 W~ 160,730 W 87,800 W 67.1116,049 W 116,049 W 93,709 W Low price Indication price Range Current stock price Company score 93,709원 116,049원 138,390원 160,730원 183,071원 Low price 87,800원 6.7% 32.2% 57.6% 83.1% 108.5% 0.% 20.% 40.% 60.% 80.% 100.% 120.% 0W 20,000W 40,000W 60,000W 80,000W 100,000W 120,000W 140,000W 160,000W 180,000W 200,000W Low price Low mid Mid High mid High price Indication price chart (Consolidated) Indication price soulbrain Gap soulbrain
- 2. [Price for scheduled purchasing] Arbitrarily made Algorithm stocks Trading Strategies (consolidated) 036830 Date Period Gap (Indication / stock) Color low price 93,709 W 93,709 W ~ 0 W 7 % -591,139 W -6 Low mid 116,049 W 116,049 W ~ 93,709 W 32 % -2,826,166 W -24 Mid 138,390 W 138,390 W ~ 116,049 W 58 % -5,061,193 W -37 High mid 160,730 W 160,730 W ~ 138,390 W 83 % -7,296,221 W -45 Suggested Purchase Amount 8,783,841 W Number of stocks purchased 100 Indication price Range Buying / Selling Buying / Selling [Stocks] High price 183,071 W 183,071 W~ ~ 160,730 W 109 % -9,531,248 W All selling 2020-02-28 3 months Current stock price Evaluation Stock price rise probability score Investment opinion Prospective purchase amount 87,800 W Low price 61.8 Buy 14,000,000 W 43.0 31.3 30.1 53.3 39.2 38.5 2019.10.01 2019.10.31 2019.11.28 2019.12.27 2020.01.30 2020.02.27 Stock price rise probability score A Sector 46.0 49.6 48.2 52.6 46.4 44.1 61.8B Sector 40.0 12.9 12.1 52.6 32.1 32.9 Total average 2019.11.28 2019.12.27 2020.01.30 2020.02.27 Total of increase rate Total score A Sector 7 % -3 % 8 % -13 % -5 % -7 % 41.3B Sector -210 % -7 % 77 % -64 % 3 % Total average -37 % -4 % 44 % -36 % -2 % 2019.10.31 46 50 48 53 46 44 40 13 12 53 32 33 43 31 30 53 39 39 0 10 20 30 40 50 60 2019.10.01 2019.10.31 2019.11.28 2019.12.27 2020.01.30 2020.02.27 Stock price rise probability score A sector B sector Total average 7% -3% 8% -13% -5% -210% -7% 77% -64% 3% -37% -4% 44% -36% -2% -250% -200% -150% -100% -50% 0% 50% 100% 2019.10.31 2019.11.28 2019.12.27 2020.01.30 2020.02.27 Increase rate of stock price rise A sector B sector Total average soulbrain
- 3. Compliance notice ① The information provided by The Algorithm Company Analysis Consulting is obtained through reliable data and information and The Algorithm Company Analysis Program (TACAP), but its accuracy or completeness are not guaranteed. Furthermore, it may change over time.Therefore, we are not legally responsible for the results of the data provided by The Algorithm Company Analysis Consulting because of information errors or omissions. ② The Algorithm Company Analysis Consulting and all the information provided on it site are reference materials for investment decisions and the final responsibility of investment is up to users utilizing this information. ③ The Algorithm Company Analysis Consulting and its site do not do anything that violates the related laws such as discretionary transaction. ④ Users can not reallocate and recycle the information provided by The Algorithm Company Analysis Consulting firm let alone the information provided by its Site. ⑤ Be sure to know about application period of this algorithm analysis report in order to improve its accuracy. Tel : 070 - 4667 - 5009 Email : tacac@tacac.co.kr Homepage : tacac.co.kr Blog : tacac.blog.me SERVICES M&A, IPO, RECOVER, CORPORATE RESTRUCTURING, MANAGEMENT OF TECHNOLOGY, BUSINESS STRATEGY, FAMILY BUSINESS Request : http://tacac.co.kr/?page_id=1374 ① Consulting is ob The Algorithm C accuracy or com may change ove for the results o Analysis Consul ② information prov investment decis up ③ do anything tha transaction. ④ by information prov ⑤ analysis report i