korea aerospace industries 047810 Algoritm Investment Report
•
0 likes•189 views

This document provides financial and stock performance data for Korea Aerospace Industries over several periods between 2018 and 2021. It includes metrics like sales, operating profit, net income, debt ratios, and stock prices. It also analyzes the company's stock price against indication price ranges and makes recommendations to purchase stocks within certain price thresholds.
![[Price for scheduled purchasing]
Arbitrarily made
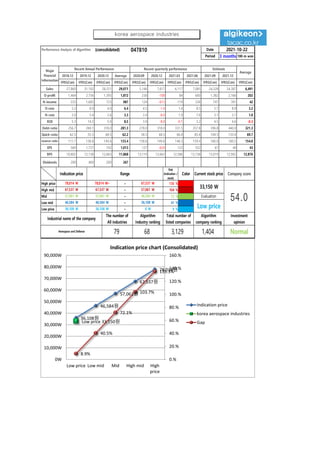
Algorithm stocks Trading Strategies (consolidated) 047810 Date
Period
Gap
(Indication /
stock)
Color
low price 36,108 W 36,108 W ~ 0 W 9 % -383,874 W -11
Low mid 46,584 W 46,584 W ~ 36,108 W 41 % -1,743,641 W -37
Mid 57,061 W 57,061 W ~ 46,584 W 72 % -3,103,409 W -54
High mid 67,537 W 67,537 W ~ 57,061 W 104 % -4,463,176 W All selling
Suggested Purchase
Amount 4,302,609 W
Number of stocks
purchased 130
Indication price Range Buying / Selling Buying / Selling [Stocks]
High price 78,014 W 78,014 W~ ~ 67,537 W 135 % -5,822,943 W All selling
2021-10-22
3 months
Current stock price Evaluation
Stock price rise
probability score
Investment opinion Prospective purchase amount
33,150 W Low price 50.3 Normal 10,000,000 W
46.9 44.1 36.5 41.3 39.7 34.1
2021.05.26 2021.06.23 2021.07.21 2021.08.19 2021.09.16 2021.10.21
Stock price rise
probability score
A Sector 48.9 44.9 51.3 45.9 48.2 47.5
50.3
B Sector 45.0 43.3 21.7 45.9 31.3 20.8
Total average
2021.07.21 2021.08.19 2021.09.16 2021.10.21
Total of
increase rate
Total score
A Sector -9 % 12 % -12 % 5 % -2 %
-7 % 39.3
B Sector -4 % -100 % 53 % -47 % -50 %
Total average -6 % -21 % 12 % -4 % -16 %
2021.06.23
49
45
51
46 48 47
45 43
22
46
31
21
47
44
36
41 40
34
0
10
20
30
40
50
60
2021.05.26 2021.06.23 2021.07.21 2021.08.19 2021.09.16 2021.10.21
Stock price rise probability score
A sector
B sector
Total average
-9%
12%
-12%
5% -2%
-4%
-100%
53%
-47% -50%
-6%
-21%
12%
-4%
-16%
-150%
-100%
-50%
0%
50%
100%
2021.06.23 2021.07.21 2021.08.19 2021.09.16 2021.10.21
Increase rate of stock price rise
A sector
B sector
Total average
korea aerospace industries](data:image/gif;base64,R0lGODlhAQABAIAAAAAAAP///yH5BAEAAAAALAAAAAABAAEAAAIBRAA7)
Recommended
Recommended
More Related Content
What's hot
What's hot (20)
Similar to korea aerospace industries 047810 Algoritm Investment Report
Similar to korea aerospace industries 047810 Algoritm Investment Report (20)
More from 알고리즘 기업분석 컨설팅-알기컨,algikeon
More from 알고리즘 기업분석 컨설팅-알기컨,algikeon (20)
Recently uploaded
Recently uploaded (20)
korea aerospace industries 047810 Algoritm Investment Report
- 1. Performance Analysis of Algorithm (consolidated) 047810 Date Period 3 months 100-m won 2018.12 2019.12 2020.12 Average 2020.09 2020.12 2021.03 2021.06 2021.09 2021.12 IFRS(Con) IFRS(Con) IFRS(Con) IFRS(Con) IFRS(Con) IFRS(Con) IFRS(Con) IFRS(Con) IFRS(Con) IFRS(Con) IFRS(Con) Sales 27,860 31,102 28,251 29,071 5,146 7,617 6,117 7,085 24,328 24,387 6,491 O-profit 1,464 2,756 1,395 1,872 230 -108 84 600 1,382 2,166 202 N-income 555 1,683 723 987 124 -613 119 538 747 761 42 O-rate 5.3 8.9 4.9 6.4 4.5 -1.4 1.4 8.5 5.7 8.9 3.2 N-rate 2.0 5.4 2.6 3.3 2.4 -8.0 1.9 7.6 3.1 3.1 1.0 ROE 5.3 14.2 5.9 8.5 3.9 -8.0 -0.1 3.2 4.5 4.6 -0.3 Debt-ratio 256.7 269.1 318.0 281.3 278.0 318.0 331.5 357.8 396.8 440.0 321.3 Quick-ratio 62.5 55.5 68.5 62.2 58.5 68.5 66.4 85.4 104.5 133.4 69.7 reserve-ratio 111.7 138.8 149.6 133.4 158.6 149.6 148.3 159.4 160.0 160.5 154.0 EPS 569 1,727 742 1,013 127 -629 122 552 67 40 43 BPS 10,802 12,138 12,663 11,868 13,119 12,663 12,586 13,138 13,019 12,902 12,876 Dividends 200 400 200 267 Major Financial Information Recent Annual Performance Recent quarterly performance Estimate Average 2021-10-22 Gap (Indication / stock) Color High price ~ 135 % High mid ~ 104 % Mid ~ 72 % Low mid ~ 41 % Low price ~ 9 % Normal 36,108 W 36,108 W 0 W Industrial name of the company The number of All industries Algorithm Industry ranking Total number of listed companies Algorithm company ranking Investment opinion Aerospace and Defense 79 68 3,129 1,404 67,537 W 67,537 W 57,061 W 57,061 W 57,061 W 46,584 W Evaluation 78,014 W 78,014 W~ 67,537 W 33,150 W 54.0 46,584 W 46,584 W 36,108 W Low price Indication price Range Current stock price Company score 36,108원 46,584원 57,061원 67,537원 78,014원 Low price 33,150원 8.9% 40.5% 72.1% 103.7% 135.3% 0.% 20.% 40.% 60.% 80.% 100.% 120.% 140.% 160.% 0W 10,000W 20,000W 30,000W 40,000W 50,000W 60,000W 70,000W 80,000W 90,000W Low price Low mid Mid High mid High price Indication price chart (Consolidated) Indication price korea aerospace industries Gap korea aerospace industries
- 2. [Price for scheduled purchasing] Arbitrarily made Algorithm stocks Trading Strategies (consolidated) 047810 Date Period Gap (Indication / stock) Color low price 36,108 W 36,108 W ~ 0 W 9 % -383,874 W -11 Low mid 46,584 W 46,584 W ~ 36,108 W 41 % -1,743,641 W -37 Mid 57,061 W 57,061 W ~ 46,584 W 72 % -3,103,409 W -54 High mid 67,537 W 67,537 W ~ 57,061 W 104 % -4,463,176 W All selling Suggested Purchase Amount 4,302,609 W Number of stocks purchased 130 Indication price Range Buying / Selling Buying / Selling [Stocks] High price 78,014 W 78,014 W~ ~ 67,537 W 135 % -5,822,943 W All selling 2021-10-22 3 months Current stock price Evaluation Stock price rise probability score Investment opinion Prospective purchase amount 33,150 W Low price 50.3 Normal 10,000,000 W 46.9 44.1 36.5 41.3 39.7 34.1 2021.05.26 2021.06.23 2021.07.21 2021.08.19 2021.09.16 2021.10.21 Stock price rise probability score A Sector 48.9 44.9 51.3 45.9 48.2 47.5 50.3 B Sector 45.0 43.3 21.7 45.9 31.3 20.8 Total average 2021.07.21 2021.08.19 2021.09.16 2021.10.21 Total of increase rate Total score A Sector -9 % 12 % -12 % 5 % -2 % -7 % 39.3 B Sector -4 % -100 % 53 % -47 % -50 % Total average -6 % -21 % 12 % -4 % -16 % 2021.06.23 49 45 51 46 48 47 45 43 22 46 31 21 47 44 36 41 40 34 0 10 20 30 40 50 60 2021.05.26 2021.06.23 2021.07.21 2021.08.19 2021.09.16 2021.10.21 Stock price rise probability score A sector B sector Total average -9% 12% -12% 5% -2% -4% -100% 53% -47% -50% -6% -21% 12% -4% -16% -150% -100% -50% 0% 50% 100% 2021.06.23 2021.07.21 2021.08.19 2021.09.16 2021.10.21 Increase rate of stock price rise A sector B sector Total average korea aerospace industries
- 3. 정보와 완전 정보 결 투자판단 있습니 위배 무단으 숙지하 Compliance notice ① The information provided by The Algorithm Company Analysis Consulting is obtained through reliable data and information and The Algorithm Company Analysis Program (TACAP), but its accuracy or completeness are not guaranteed. Furthermore, it may change over time.Therefore, we are not legally responsible for the results of the data provided by The Algorithm Company Analysis Consulting because of information errors or omissions. ② The Algorithm Company Analysis Consulting and all the information provided on it site are reference materials for investment decisions and the final responsibility of investment is up to users utilizing this information. ③ The Algorithm Company Analysis Consulting and its site do not do anything that violates the related laws such as discretionary transaction. ④ Users can not reallocate and recycle the information provided by The Algorithm Company Analysis Consulting firm let alone the information provided by its Site. ⑤ Be sure to know about application period of this algorithm analysis report in order to improve its accuracy. Tel : 070 - 4667 - 5009 Email : tacac@tacac.co.kr Homepage : tacac.co.kr Blog : tacac.blog.me SERVICES M&A, IPO, RECOVER, CORPORATE RESTRUCTURING, MANAGEMENT OF TECHNOLOGY, BUSINESS STRATEGY, FAMILY BUSINESS Request : http://tacac.co.kr/?page_id=1374 ① Consulting is o The Algorithm accuracy or com change over tim results of the d Consulting bec ② information pr investment dec up ③ do anything th transaction. ④ The Algorithm information pr ⑤ analysis report