celltrion 068270 Algorithm Investment Report
•
0 likes•95 views

celltrion 068270 Algorithm Investment Report
![[Price for scheduled purchasing]
Arbitrarily made
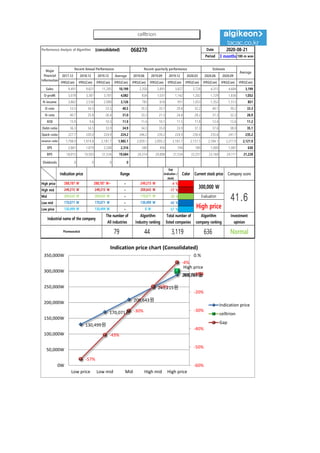
Algorithm stocks Trading Strategies (consolidated) 068270 Date
Period
Gap
(Indication /
stock)
Color
low price 130,499 W 130,499 W ~ 0 W -57 % 450,908 W 3
Low mid 170,071 W 170,071 W ~ 130,499 W -43 % 345,638 W 2
Mid 209,643 W 209,643 W ~ 170,071 W -30 % 240,368 W 1
High mid 249,215 W 249,215 W ~ 209,643 W -17 % 135,099 W 1
Suggested Purchase
Amount 798,064 W
Number of stocks
purchased 3
Indication price Range Buying / Selling Buying / Selling [Stocks]
High price 288,787 W 288,787 W~ ~ 249,215 W -4 % 29,829 W 0
2020-08-21
3 months
Current stock price Evaluation
Stock price rise
probability score
Investment opinion Prospective purchase amount
300,000 W High price 42.0 Normal 2,500,000 W
45.4 29.8 43.0 42.1 38.1 27.3
2020.03.26 2020.04.24 2020.05.27 2020.06.24 2020.07.22 2020.08.20
Stock price rise
probability score
A Sector 47.4 46.7 50.2 50.9 52.9 42.5
42.0B Sector 43.3 12.9 35.8 50.9 23.3 12.1
Total average
2020.05.27 2020.06.24 2020.07.22 2020.08.20
Total of
increase rate
Total score
A Sector -2 % 7 % 1 % 4 % -25 %
-15 % 38.3B Sector -235 % 64 % 30 % -118 % -93 %
Total average -52 % 31 % -2 % -10 % -40 %
2020.04.24
47 47
50 51 53
4243
13
36
51
23
12
45
30
43 42
38
27
0
10
20
30
40
50
60
2020.03.26 2020.04.24 2020.05.27 2020.06.24 2020.07.22 2020.08.20
Stock price rise probability score
A sector
B sector
Total average
-2% 7% 1% 4%
-25%
-235%
64%
30%
-118%
-93%
-52%
31%
-2% -10%
-40%
-300%
-250%
-200%
-150%
-100%
-50%
0%
50%
100%
2020.04.24 2020.05.27 2020.06.24 2020.07.22 2020.08.20
Increase rate of stock price rise
A sector
B sector
Total average
celltrion](data:image/gif;base64,R0lGODlhAQABAIAAAAAAAP///yH5BAEAAAAALAAAAAABAAEAAAIBRAA7)
Recommended
Recommended
More Related Content
What's hot
What's hot (20)
Similar to celltrion 068270 Algorithm Investment Report
Similar to celltrion 068270 Algorithm Investment Report (20)
More from 알고리즘 기업분석 컨설팅-알기컨,algikeon
More from 알고리즘 기업분석 컨설팅-알기컨,algikeon (20)
Recently uploaded
Recently uploaded (20)
celltrion 068270 Algorithm Investment Report
- 1. Performance Analysis of Algorithm (consolidated) 068270 Date Period 3 months 100-m won 2017.12 2018.12 2019.12 Average 2019.06 2019.09 2019.12 2020.03 2020.06 2020.09 IFRS(Con) IFRS(Con) IFRS(Con) IFRS(Con) IFRS(Con) IFRS(Con) IFRS(Con) IFRS(Con) IFRS(Con) IFRS(Con) IFRS(Con) Sales 9,491 9,821 11,285 10,199 2,350 2,891 3,827 3,728 4,315 4,684 3,199 O-profit 5,078 3,387 3,781 4,082 834 1,031 1,142 1,202 1,729 1,836 1,052 N-income 3,862 2,536 2,980 3,126 783 616 951 1,053 1,352 1,513 851 O-rate 53.5 34.5 33.5 40.5 35.5 35.7 29.8 32.2 40.1 39.2 33.3 N-rate 40.7 25.8 26.4 31.0 33.3 21.3 24.8 28.2 31.3 32.3 26.9 ROE 15.9 9.6 10.3 11.9 11.4 10.1 11.5 11.8 12.4 12.6 11.2 Debt-ratio 36.3 34.5 33.9 34.9 34.3 35.0 33.9 37.3 37.6 38.0 35.1 Quick-ratio 227.7 220.0 224.9 224.2 246.2 239.2 224.9 230.4 235.6 241.7 235.2 reserve-ratio 1,798.9 1,974.8 2,181.7 1,985.1 2,059.1 2,095.2 2,181.7 2,151.5 2,184.1 2,217.9 2,121.9 EPS 2,861 1,879 2,208 2,316 580 456 704 780 1,000 1,081 630 BPS 18,015 19,503 21,534 19,684 20,314 20,808 21,534 22,257 23,168 24,117 21,228 Dividends 0 0 0 0 Major Financial Information Recent Annual Performance Recent quarterly performance Estimate Average 2020-08-21 Gap (Indication / stock) Color High price ~ -4 % High mid ~ -17 % Mid ~ -30 % Low mid ~ -43 % Low price ~ -57 % Normal 130,499 W 130,499 W 0 W Industrial name of the company The number of All industries Algorithm Industry ranking Total number of listed companies Algorithm company ranking Investment opinion Pharmaceutical 79 44 3,119 636 249,215 W 249,215 W 209,643 W 209,643 W 209,643 W 170,071 W Evaluation 288,787 W 288,787 W~ 249,215 W 300,000 W 41.6170,071 W 170,071 W 130,499 W High price Indication price Range Current stock price Company score 130,499원 170,071원 209,643원 249,215원 288,787원 High price 300,000원 -57% -43% -30% -17% -4% -60% -50% -40% -30% -20% -10% 0.% 0W 50,000W 100,000W 150,000W 200,000W 250,000W 300,000W 350,000W Low price Low mid Mid High mid High price Indication price chart (Consolidated) Indication price celltrion Gap celltrion
- 2. [Price for scheduled purchasing] Arbitrarily made Algorithm stocks Trading Strategies (consolidated) 068270 Date Period Gap (Indication / stock) Color low price 130,499 W 130,499 W ~ 0 W -57 % 450,908 W 3 Low mid 170,071 W 170,071 W ~ 130,499 W -43 % 345,638 W 2 Mid 209,643 W 209,643 W ~ 170,071 W -30 % 240,368 W 1 High mid 249,215 W 249,215 W ~ 209,643 W -17 % 135,099 W 1 Suggested Purchase Amount 798,064 W Number of stocks purchased 3 Indication price Range Buying / Selling Buying / Selling [Stocks] High price 288,787 W 288,787 W~ ~ 249,215 W -4 % 29,829 W 0 2020-08-21 3 months Current stock price Evaluation Stock price rise probability score Investment opinion Prospective purchase amount 300,000 W High price 42.0 Normal 2,500,000 W 45.4 29.8 43.0 42.1 38.1 27.3 2020.03.26 2020.04.24 2020.05.27 2020.06.24 2020.07.22 2020.08.20 Stock price rise probability score A Sector 47.4 46.7 50.2 50.9 52.9 42.5 42.0B Sector 43.3 12.9 35.8 50.9 23.3 12.1 Total average 2020.05.27 2020.06.24 2020.07.22 2020.08.20 Total of increase rate Total score A Sector -2 % 7 % 1 % 4 % -25 % -15 % 38.3B Sector -235 % 64 % 30 % -118 % -93 % Total average -52 % 31 % -2 % -10 % -40 % 2020.04.24 47 47 50 51 53 4243 13 36 51 23 12 45 30 43 42 38 27 0 10 20 30 40 50 60 2020.03.26 2020.04.24 2020.05.27 2020.06.24 2020.07.22 2020.08.20 Stock price rise probability score A sector B sector Total average -2% 7% 1% 4% -25% -235% 64% 30% -118% -93% -52% 31% -2% -10% -40% -300% -250% -200% -150% -100% -50% 0% 50% 100% 2020.04.24 2020.05.27 2020.06.24 2020.07.22 2020.08.20 Increase rate of stock price rise A sector B sector Total average celltrion
- 3. 정보와 완전 정보 결 투자판단 있습니 위배 무단으 숙지하 Compliance notice ① The information provided by The Algorithm Company Analysis Consulting is obtained through reliable data and information and The Algorithm Company Analysis Program (TACAP), but its accuracy or completeness are not guaranteed. Furthermore, it may change over time.Therefore, we are not legally responsible for the results of the data provided by The Algorithm Company Analysis Consulting because of information errors or omissions. ② The Algorithm Company Analysis Consulting and all the information provided on it site are reference materials for investment decisions and the final responsibility of investment is up to users utilizing this information. ③ The Algorithm Company Analysis Consulting and its site do not do anything that violates the related laws such as discretionary transaction. ④ Users can not reallocate and recycle the information provided by The Algorithm Company Analysis Consulting firm let alone the information provided by its Site. ⑤ Be sure to know about application period of this algorithm analysis report in order to improve its accuracy. Tel : 070 - 4667 - 5009 Email : tacac@tacac.co.kr Homepage : tacac.co.kr Blog : tacac.blog.me SERVICES M&A, IPO, RECOVER, CORPORATE RESTRUCTURING, MANAGEMENT OF TECHNOLOGY, BUSINESS STRATEGY, FAMILY BUSINESS Request : http://tacac.co.kr/?page_id=1374 ① Consulting is o The Algorithm accuracy or com change over tim results of the d Consulting bec ② information pr investment dec up ③ do anything th transaction. ④ The Algorithm information pr ⑤ analysis report