naver 035420 Algorithm Investment Report
•
0 likes•7 views

This document provides financial and performance data for a company over several periods from 2020-2023. It includes quarterly sales, profit, income, rates of return, debt ratios, and other metrics. It also analyzes the company's stock price against indication prices at different confidence levels. Graphs show the company's stock price probability score compared to industry averages over time as well as percentage changes in stock prices. The document recommends a prospective purchase amount for the company's stock based on a current evaluation of normal and a stock price near the low mid indication range.
![[Price for scheduled purchasing]
Arbitrarily made
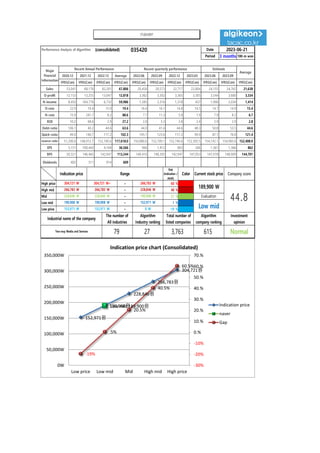
Algorithm stocks Trading Strategies (consolidated) 035420 Date
Period
Gap
(Indication /
stock)
Color
low price 152,971 W 152,971 W ~ 0 W -19 % 315,775 W 2
Low mid 190,908 W 190,908 W ~ 152,971 W 1 % -8,623 W -0
Mid 228,846 W 228,846 W ~ 190,908 W 21 % -333,022 W -1
High mid 266,783 W 266,783 W ~ 228,846 W 40 % -657,421 W -2
Suggested Purchase
Amount 1,623,811 W
Number of stocks
purchased 9
Indication price Range Buying / Selling Buying / Selling [Stocks]
High price 304,721 W 304,721 W~ ~ 266,783 W 60 % -981,820 W -3
2023-06-21
3 months
Current stock price Evaluation
Stock price rise
probability score
Investment opinion Prospective purchase amount
189,900 W Low mid 43.5 Normal 3,800,000 W
39.3 43.5 42.2 50.8 48.0 40.2
2023.01.20 2023.02.21 2023.03.22 2023.04.19 2023.05.19 2023.06.20
Stock price rise
probability score
A Sector 50.4 48.3 47.7 42.8 50.3 48.0
43.5
B Sector 28.3 38.8 36.7 42.8 45.8 32.5
Total average
2023.03.22 2023.04.19 2023.05.19 2023.06.20
Total of
increase rate
Total score
A Sector -4 % -1 % -11 % 15 % -5 %
-0 % 47.0
B Sector 27 % -6 % 14 % 7 % -41 %
Total average 10 % -3 % 17 % -6 % -19 %
2023.02.21
50 48 48
43
50 48
28
39 37
43
46
33
39
44 42
51
48
40
0
10
20
30
40
50
60
2023.01.20 2023.02.21 2023.03.22 2023.04.19 2023.05.19 2023.06.20
Stock price rise probability score
A sector
B sector
Total average
-4% -1%
-11%
15%
-5%
27%
-6%
14%
7%
-41%
10%
-3%
17%
-6%
-19%
-50%
-40%
-30%
-20%
-10%
0%
10%
20%
30%
40%
2023.02.21 2023.03.22 2023.04.19 2023.05.19 2023.06.20
Increase rate of stock price rise
A sector
B sector
Total average
naver](data:image/gif;base64,R0lGODlhAQABAIAAAAAAAP///yH5BAEAAAAALAAAAAABAAEAAAIBRAA7)
Recommended
Recommended
More Related Content
Similar to naver 035420 Algorithm Investment Report
Similar to naver 035420 Algorithm Investment Report (20)
More from 알고리즘 기업분석 컨설팅-알기컨,algikeon
More from 알고리즘 기업분석 컨설팅-알기컨,algikeon (20)
Recently uploaded
Recently uploaded (20)
naver 035420 Algorithm Investment Report
- 1. Performance Analysis of Algorithm (consolidated) 035420 Date Period 3 months 100-m won 2020.12 2021.12 2022.12 Average 2022.06 2022.09 2022.12 2023.03 2023.06 2023.09 IFRS(Con) IFRS(Con) IFRS(Con) IFRS(Con) IFRS(Con) IFRS(Con) IFRS(Con) IFRS(Con) IFRS(Con) IFRS(Con) IFRS(Con) Sales 53,041 68,176 82,201 67,806 20,458 20,573 22,717 22,804 24,155 24,762 21,638 O-profit 12,153 13,255 13,047 12,818 3,362 3,302 3,365 3,305 3,544 3,680 3,334 N-income 8,450 164,776 6,732 59,986 1,585 2,316 1,318 437 1,906 2,034 1,414 O-rate 22.9 19.4 15.9 19.4 16.4 16.1 14.8 14.5 14.7 14.9 15.4 N-rate 15.9 241.7 8.2 88.6 7.7 11.3 5.8 1.9 7.9 8.2 6.7 ROE 10.2 68.6 2.9 27.2 2.8 3.3 2.8 2.4 2.9 2.9 2.8 Debt-ratio 106.1 40.2 44.6 63.6 44.0 41.4 44.6 48.3 50.8 53.5 44.6 Quick-ratio 49.0 140.7 117.2 102.3 145.1 123.6 117.2 99.9 87.1 76.0 121.4 reserve-ratio 51,200.6 148,912.7 152,740.6 117,618.0 150,880.6 152,709.1 152,740.6 153,305.5 154,142.1 154,985.6 152,408.9 EPS 5,151 100,443 4,104 36,566 966 1,412 803 266 1,361 1,366 862 BPS 50,321 146,465 142,947 113,244 140,410 148,395 142,947 147,053 147,978 148,909 144,701 Dividends 402 511 914 609 Major Financial Information Recent Annual Performance Recent quarterly performance Estimate Average 2023-06-21 Gap (Indication / stock) Color High price ~ 60 % High mid ~ 40 % Mid ~ 21 % Low mid ~ 1 % Low price ~ -19 % Normal 152,971 W 152,971 W 0 W Industrial name of the company The number of All industries Algorithm Industry ranking Total number of listed companies Algorithm company ranking Investment opinion Two-way Media and Services 79 27 3,763 615 266,783 W 266,783 W 228,846 W 228,846 W 228,846 W 190,908 W Evaluation 304,721 W 304,721 W~ 266,783 W 189,900 W 44.8 190,908 W 190,908 W 152,971 W Low mid Indication price Range Current stock price Company score 152,971원 190,908원 228,846원 266,783원 304,721원 Low mid 189,900원 -19% .5% 20.5% 40.5% 60.5% -30% -20% -10% 0.% 10.% 20.% 30.% 40.% 50.% 60.% 70.% 0W 50,000W 100,000W 150,000W 200,000W 250,000W 300,000W 350,000W Low price Low mid Mid High mid High price Indication price chart (Consolidated) Indication price naver Gap naver
- 2. [Price for scheduled purchasing] Arbitrarily made Algorithm stocks Trading Strategies (consolidated) 035420 Date Period Gap (Indication / stock) Color low price 152,971 W 152,971 W ~ 0 W -19 % 315,775 W 2 Low mid 190,908 W 190,908 W ~ 152,971 W 1 % -8,623 W -0 Mid 228,846 W 228,846 W ~ 190,908 W 21 % -333,022 W -1 High mid 266,783 W 266,783 W ~ 228,846 W 40 % -657,421 W -2 Suggested Purchase Amount 1,623,811 W Number of stocks purchased 9 Indication price Range Buying / Selling Buying / Selling [Stocks] High price 304,721 W 304,721 W~ ~ 266,783 W 60 % -981,820 W -3 2023-06-21 3 months Current stock price Evaluation Stock price rise probability score Investment opinion Prospective purchase amount 189,900 W Low mid 43.5 Normal 3,800,000 W 39.3 43.5 42.2 50.8 48.0 40.2 2023.01.20 2023.02.21 2023.03.22 2023.04.19 2023.05.19 2023.06.20 Stock price rise probability score A Sector 50.4 48.3 47.7 42.8 50.3 48.0 43.5 B Sector 28.3 38.8 36.7 42.8 45.8 32.5 Total average 2023.03.22 2023.04.19 2023.05.19 2023.06.20 Total of increase rate Total score A Sector -4 % -1 % -11 % 15 % -5 % -0 % 47.0 B Sector 27 % -6 % 14 % 7 % -41 % Total average 10 % -3 % 17 % -6 % -19 % 2023.02.21 50 48 48 43 50 48 28 39 37 43 46 33 39 44 42 51 48 40 0 10 20 30 40 50 60 2023.01.20 2023.02.21 2023.03.22 2023.04.19 2023.05.19 2023.06.20 Stock price rise probability score A sector B sector Total average -4% -1% -11% 15% -5% 27% -6% 14% 7% -41% 10% -3% 17% -6% -19% -50% -40% -30% -20% -10% 0% 10% 20% 30% 40% 2023.02.21 2023.03.22 2023.04.19 2023.05.19 2023.06.20 Increase rate of stock price rise A sector B sector Total average naver
- 3. 정보와 완전 정보 결 투자판단 있습니 위배 무단으 숙지하 Compliance notice ① The information provided by The Algorithm Company Analysis Consulting is obtained through reliable data and information and The Algorithm Company Analysis Program (TACAP), but its accuracy or completeness are not guaranteed. Furthermore, it may change over time.Therefore, we are not legally responsible for the results of the data provided by The Algorithm Company Analysis Consulting because of information errors or omissions. ② The Algorithm Company Analysis Consulting and all the information provided on it site are reference materials for investment decisions and the final responsibility of investment is up to users utilizing this information. ③ The Algorithm Company Analysis Consulting and its site do not do anything that violates the related laws such as discretionary transaction. ④ Users can not reallocate and recycle the information provided by The Algorithm Company Analysis Consulting firm let alone the information provided by its Site. ⑤ Be sure to know about application period of this algorithm analysis report in order to improve its accuracy. Tel : 070 - 4667 - 5009 Email : tacac@tacac.co.kr Homepage : tacac.co.kr Blog : tacac.blog.me SERVICES M&A, IPO, RECOVER, CORPORATE RESTRUCTURING, MANAGEMENT OF TECHNOLOGY, BUSINESS STRATEGY, FAMILY BUSINESS Request : http://tacac.co.kr/?page_id=1374 ① Consulting is o The Algorithm accuracy or com change over tim results of the d Consulting bec ② information pr investment dec up ③ do anything th transaction. ④ The Algorithm information pr ⑤ analysis report