samyang foods 003230 Algorithm Investment Report
•
0 likes•5 views

This document provides financial and performance data for Algorithm company over several periods from 2020 to 2023. It includes key metrics like sales, operating profit, net income, debt ratios, and stock prices over time. It also analyzes the company's stock against indication price ranges and provides strategies for purchasing the stock going forward based on probability scoring.
![[Price for scheduled purchasing]
Arbitrarily made
Algorithm stocks Trading Strategies (consolidated) 003230 Date
Period
Gap
(Indication /
stock)
Color
low price 151,548 W 151,548 W ~ 0 W 28 % -1,209,182 W -8
Low mid 184,497 W 184,497 W ~ 151,548 W 55 % -2,425,805 W -13
Mid 217,446 W 217,446 W ~ 184,497 W 83 % -3,642,427 W -17
High mid 250,395 W 250,395 W ~ 217,446 W 111 % -4,859,050 W All selling
Suggested Purchase
Amount 4,386,620 W
Number of stocks
purchased 37
Indication price Range Buying / Selling Buying / Selling [Stocks]
High price 283,344 W 283,344 W~ ~ 250,395 W 139 % -6,075,672 W All selling
2023-08-07
3 months
Current stock price Evaluation
Stock price rise
probability score
Investment opinion Prospective purchase amount
118,800 W Low price 43.3 Normal 9,400,000 W
42.4 37.3 41.4 50.4 43.1 47.0
2023.03.13 2023.04.10 2023.05.10 2023.06.09 2023.07.07 2023.08.04
Stock price rise
probability score
A Sector 47.4 50.4 48.7 55.4 50.9 46.1
43.3
B Sector 37.5 24.2 34.2 55.4 35.4 47.9
Total average
2023.05.10 2023.06.09 2023.07.07 2023.08.04
Total of
increase rate
Total score
A Sector 6 % -4 % 12 % -9 % -10 %
1 % 47.7
B Sector -55 % 29 % 38 % -56 % 26 %
Total average -14 % 10 % 18 % -17 % 8 %
2023.04.10
47
50 49
55
51
46
38
24
34
55
35
48
42
37
41
50
43
47
0
10
20
30
40
50
60
2023.03.13 2023.04.10 2023.05.10 2023.06.09 2023.07.07 2023.08.04
Stock price rise probability score
A sector
B sector
Total average
6%
-4%
12%
-9% -10%
-55%
29%
38%
-56%
26%
-14%
10%
18%
-17%
8%
-80%
-60%
-40%
-20%
0%
20%
40%
60%
2023.04.10 2023.05.10 2023.06.09 2023.07.07 2023.08.04
Increase rate of stock price rise
A sector
B sector
Total average
samyang foods](data:image/gif;base64,R0lGODlhAQABAIAAAAAAAP///yH5BAEAAAAALAAAAAABAAEAAAIBRAA7)
Recommended
Recommended
More Related Content
Similar to samyang foods 003230 Algorithm Investment Report
Similar to samyang foods 003230 Algorithm Investment Report (20)
More from 알고리즘 기업분석 컨설팅-알기컨,algikeon
More from 알고리즘 기업분석 컨설팅-알기컨,algikeon (20)
Recently uploaded
Recently uploaded (20)
samyang foods 003230 Algorithm Investment Report
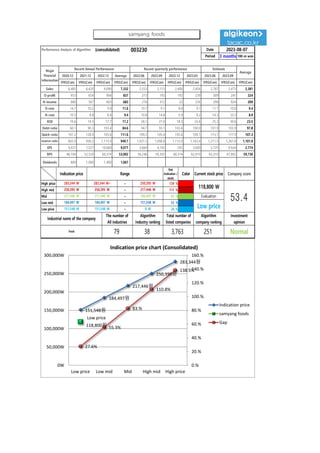
- 1. Performance Analysis of Algorithm (consolidated) 003230 Date Period 3 months 100-m won 2020.12 2021.12 2022.12 Average 2022.06 2022.09 2022.12 2023.03 2023.06 2023.09 IFRS(Con) IFRS(Con) IFRS(Con) IFRS(Con) IFRS(Con) IFRS(Con) IFRS(Con) IFRS(Con) IFRS(Con) IFRS(Con) IFRS(Con) Sales 6,485 6,420 9,090 7,332 2,553 2,115 2,400 2,456 2,787 2,473 2,381 O-profit 953 654 904 837 273 193 192 239 309 247 224 N-income 680 567 803 683 276 312 22 226 398 824 209 O-rate 14.7 10.2 9.9 11.6 10.7 9.1 8.0 9.7 11.1 10.0 9.4 N-rate 10.5 8.8 8.8 9.4 10.8 14.8 0.9 9.2 14.3 33.3 8.9 ROE 19.6 14.3 17.7 17.2 26.1 27.0 18.3 22.6 25.3 30.6 23.5 Debt-ratio 60.1 90.3 103.4 84.6 94.7 93.1 103.4 100.0 101.9 103.9 97.8 Quick-ratio 101.2 128.0 105.6 111.6 109.2 105.4 105.6 109.1 113.1 117.9 107.3 reserve-ratio 802.9 930.2 1,115.9 949.7 1,031.3 1,096.8 1,115.9 1,163.4 1,211.5 1,261.8 1,101.9 EPS 9,027 7,527 10,660 9,071 3,664 4,142 292 3,000 5,725 9,924 2,774 BPS 46,104 52,529 60,374 53,002 56,246 59,392 60,374 62,910 65,310 67,802 59,730 Dividends 800 1,000 1,400 1,067 Major Financial Information Recent Annual Performance Recent quarterly performance Estimate Average 2023-08-07 Gap (Indication / stock) Color High price ~ 139 % High mid ~ 111 % Mid ~ 83 % Low mid ~ 55 % Low price ~ 28 % Normal 151,548 W 151,548 W 0 W Industrial name of the company The number of All industries Algorithm Industry ranking Total number of listed companies Algorithm company ranking Investment opinion Food 79 38 3,763 251 250,395 W 250,395 W 217,446 W 217,446 W 217,446 W 184,497 W Evaluation 283,344 W 283,344 W~ 250,395 W 118,800 W 53.4 184,497 W 184,497 W 151,548 W Low price Indication price Range Current stock price Company score 151,548원 184,497원 217,446원 250,395원 283,344원 Low price 118,800원 27.6% 55.3% 83.% 110.8% 138.5% 0.% 20.% 40.% 60.% 80.% 100.% 120.% 140.% 160.% 0W 50,000W 100,000W 150,000W 200,000W 250,000W 300,000W Low price Low mid Mid High mid High price Indication price chart (Consolidated) Indication price samyang foods Gap samyang foods
- 2. [Price for scheduled purchasing] Arbitrarily made Algorithm stocks Trading Strategies (consolidated) 003230 Date Period Gap (Indication / stock) Color low price 151,548 W 151,548 W ~ 0 W 28 % -1,209,182 W -8 Low mid 184,497 W 184,497 W ~ 151,548 W 55 % -2,425,805 W -13 Mid 217,446 W 217,446 W ~ 184,497 W 83 % -3,642,427 W -17 High mid 250,395 W 250,395 W ~ 217,446 W 111 % -4,859,050 W All selling Suggested Purchase Amount 4,386,620 W Number of stocks purchased 37 Indication price Range Buying / Selling Buying / Selling [Stocks] High price 283,344 W 283,344 W~ ~ 250,395 W 139 % -6,075,672 W All selling 2023-08-07 3 months Current stock price Evaluation Stock price rise probability score Investment opinion Prospective purchase amount 118,800 W Low price 43.3 Normal 9,400,000 W 42.4 37.3 41.4 50.4 43.1 47.0 2023.03.13 2023.04.10 2023.05.10 2023.06.09 2023.07.07 2023.08.04 Stock price rise probability score A Sector 47.4 50.4 48.7 55.4 50.9 46.1 43.3 B Sector 37.5 24.2 34.2 55.4 35.4 47.9 Total average 2023.05.10 2023.06.09 2023.07.07 2023.08.04 Total of increase rate Total score A Sector 6 % -4 % 12 % -9 % -10 % 1 % 47.7 B Sector -55 % 29 % 38 % -56 % 26 % Total average -14 % 10 % 18 % -17 % 8 % 2023.04.10 47 50 49 55 51 46 38 24 34 55 35 48 42 37 41 50 43 47 0 10 20 30 40 50 60 2023.03.13 2023.04.10 2023.05.10 2023.06.09 2023.07.07 2023.08.04 Stock price rise probability score A sector B sector Total average 6% -4% 12% -9% -10% -55% 29% 38% -56% 26% -14% 10% 18% -17% 8% -80% -60% -40% -20% 0% 20% 40% 60% 2023.04.10 2023.05.10 2023.06.09 2023.07.07 2023.08.04 Increase rate of stock price rise A sector B sector Total average samyang foods
- 3. 정보와 완전 정보 결 투자판단 있습니 위배 무단으 숙지하 Compliance notice ① The information provided by The Algorithm Company Analysis Consulting is obtained through reliable data and information and The Algorithm Company Analysis Program (TACAP), but its accuracy or completeness are not guaranteed. Furthermore, it may change over time.Therefore, we are not legally responsible for the results of the data provided by The Algorithm Company Analysis Consulting because of information errors or omissions. ② The Algorithm Company Analysis Consulting and all the information provided on it site are reference materials for investment decisions and the final responsibility of investment is up to users utilizing this information. ③ The Algorithm Company Analysis Consulting and its site do not do anything that violates the related laws such as discretionary transaction. ④ Users can not reallocate and recycle the information provided by The Algorithm Company Analysis Consulting firm let alone the information provided by its Site. ⑤ Be sure to know about application period of this algorithm analysis report in order to improve its accuracy. Tel : 070 - 4667 - 5009 Email : tacac@tacac.co.kr Homepage : tacac.co.kr Blog : tacac.blog.me SERVICES M&A, IPO, RECOVER, CORPORATE RESTRUCTURING, MANAGEMENT OF TECHNOLOGY, BUSINESS STRATEGY, FAMILY BUSINESS Request : http://tacac.co.kr/?page_id=1374 ① Consulting is o The Algorithm accuracy or com change over tim results of the d Consulting bec ② information pr investment dec up ③ do anything th transaction. ④ The Algorithm information pr ⑤ analysis report