chong kun dang bio 063160 Algorithm Investment Report
•
1 like•128 views

This document provides financial and stock performance data for a company over several years on a quarterly and annual basis. It includes metrics like sales, operating profit, net income, debt ratios, and stock prices. It also evaluates the company's current stock price compared to an indication price range and assigns a probability score for the stock price rising. The document recommends a purchase amount for the stock based on the analysis.
![[Price for scheduled purchasing]
Arbitrarily made
Algorithm stocks Trading Strategies (consolidated) 063160 Date
Period
Gap
(Indication /
stock)
Color
low price 24,360 W 24,360 W ~ 0 W -64 % 178,518 W 7
Low mid 30,543 W 30,543 W ~ 24,360 W -55 % 152,812 W 5
Mid 36,726 W 36,726 W ~ 30,543 W -45 % 127,106 W 3
High mid 42,909 W 42,909 W ~ 36,726 W -36 % 101,400 W 2
Suggested Purchase
Amount 279,788 W
Number of stocks
purchased 4
Indication price Range Buying / Selling Buying / Selling [Stocks]
High price 49,092 W 49,092 W~ ~ 42,909 W -27 % 75,695 W 2
2021-05-12
3 months
Current stock price Evaluation
Stock price rise
probability score
Investment opinion Prospective purchase amount
67,300 W High price 30.6 Sell 1,500,000 W
45.1 39.7 37.0 11.7 35.6 42.8
2020.12.11 2021.01.13 2021.02.10 2021.03.15 2021.04.12 2021.05.11
Stock price rise
probability score
A Sector 45.6 43.1 54.8 51.2 49.0 49.3
30.6
B Sector 44.6 36.3 19.2 51.2 22.1 36.3
Total average
2021.02.10 2021.03.15 2021.04.12 2021.05.11
Total of
increase rate
Total score
A Sector -6 % 21 % -7 % -4 % 1 %
-31 % 45.0
B Sector -23 % -89 % 63 % -132 % 39 %
Total average -14 % -7 % -217 % 67 % 17 %
2021.01.13
46 43
55
51 49 49
45
36
19
51
22
36
45
40
37
12
36
43
0
10
20
30
40
50
60
2020.12.11 2021.01.13 2021.02.10 2021.03.15 2021.04.12 2021.05.11
Stock price rise probability score
A sector
B sector
Total average
-6%
21%
-7% -4% 1%
-23%
-89%
63%
-132%
39%
-14% -7%
-217%
67%
17%
-250%
-200%
-150%
-100%
-50%
0%
50%
100%
2021.01.13 2021.02.10 2021.03.15 2021.04.12 2021.05.11
Increase rate of stock price rise
A sector
B sector
Total average
chong kun dang bio](data:image/gif;base64,R0lGODlhAQABAIAAAAAAAP///yH5BAEAAAAALAAAAAABAAEAAAIBRAA7)
Recommended
Recommended
More Related Content
What's hot
What's hot (20)
Similar to chong kun dang bio 063160 Algorithm Investment Report
Similar to chong kun dang bio 063160 Algorithm Investment Report (20)
More from 알고리즘 기업분석 컨설팅-알기컨,algikeon
More from 알고리즘 기업분석 컨설팅-알기컨,algikeon (20)
Recently uploaded
Recently uploaded (8)
chong kun dang bio 063160 Algorithm Investment Report
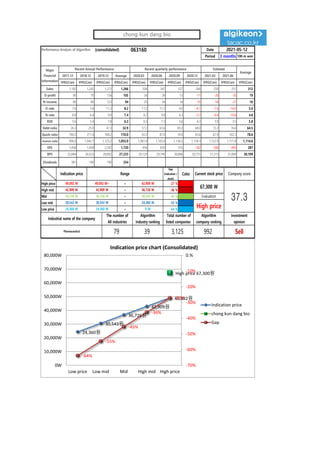
- 1. Performance Analysis of Algorithm (consolidated) 063160 Date Period 3 months 100-m won 2017.12 2018.12 2019.12 Average 2020.03 2020.06 2020.09 2020.12 2021.03 2021.06 IFRS(Con) IFRS(Con) IFRS(Con) IFRS(Con) IFRS(Con) IFRS(Con) IFRS(Con) IFRS(Con) IFRS(Con) IFRS(Con) IFRS(Con) Sales 1,182 1,245 1,372 1,266 304 347 327 268 259 251 312 O-profit 90 70 154 105 34 39 13 -11 -20 -35 19 N-income 80 80 123 94 25 34 14 -10 -16 -27 16 O-rate 7.6 5.6 11.2 8.2 11.2 11.2 4.0 -4.1 -7.6 -14.0 5.6 N-rate 6.8 6.4 9.0 7.4 8.2 9.8 4.3 -3.7 -6.4 -10.8 4.6 ROE 5.6 5.4 7.8 6.3 6.3 7.3 5.6 4.2 3.9 3.5 5.8 Debt-ratio 26.3 25.0 47.3 32.9 57.2 63.6 69.3 68.0 72.2 76.6 64.5 Quick-ratio 190.3 211.4 108.2 170.0 92.2 81.9 76.9 63.6 67.9 102.3 78.6 reserve-ratio 996.9 1,042.7 1,125.2 1,055.0 1,081.8 1,105.8 1,136.5 1,134.3 1,152.9 1,171.8 1,114.6 EPS 1,458 1,458 2,242 1,720 456 620 255 -182 -300 -495 287 BPS 25,884 26,923 28,892 27,233 29,129 29,749 30,806 30,751 31,315 31,890 30,109 Dividends 381 190 190 254 Major Financial Information Recent Annual Performance Recent quarterly performance Estimate Average 2021-05-12 Gap (Indication / stock) Color High price ~ -27 % High mid ~ -36 % Mid ~ -45 % Low mid ~ -55 % Low price ~ -64 % Sell 24,360 W 24,360 W 0 W Industrial name of the company The number of All industries Algorithm Industry ranking Total number of listed companies Algorithm company ranking Investment opinion Pharmaceutical 79 39 3,125 992 42,909 W 42,909 W 36,726 W 36,726 W 36,726 W 30,543 W Evaluation 49,092 W 49,092 W~ 42,909 W 67,300 W 37.3 30,543 W 30,543 W 24,360 W High price Indication price Range Current stock price Company score 24,360원 30,543원 36,726원 42,909원 49,092원 High price 67,300원 -64% -55% -45% -36% -27% -70% -60% -50% -40% -30% -20% -10% 0.% 0W 10,000W 20,000W 30,000W 40,000W 50,000W 60,000W 70,000W 80,000W Low price Low mid Mid High mid High price Indication price chart (Consolidated) Indication price chong kun dang bio Gap chong kun dang bio
- 2. [Price for scheduled purchasing] Arbitrarily made Algorithm stocks Trading Strategies (consolidated) 063160 Date Period Gap (Indication / stock) Color low price 24,360 W 24,360 W ~ 0 W -64 % 178,518 W 7 Low mid 30,543 W 30,543 W ~ 24,360 W -55 % 152,812 W 5 Mid 36,726 W 36,726 W ~ 30,543 W -45 % 127,106 W 3 High mid 42,909 W 42,909 W ~ 36,726 W -36 % 101,400 W 2 Suggested Purchase Amount 279,788 W Number of stocks purchased 4 Indication price Range Buying / Selling Buying / Selling [Stocks] High price 49,092 W 49,092 W~ ~ 42,909 W -27 % 75,695 W 2 2021-05-12 3 months Current stock price Evaluation Stock price rise probability score Investment opinion Prospective purchase amount 67,300 W High price 30.6 Sell 1,500,000 W 45.1 39.7 37.0 11.7 35.6 42.8 2020.12.11 2021.01.13 2021.02.10 2021.03.15 2021.04.12 2021.05.11 Stock price rise probability score A Sector 45.6 43.1 54.8 51.2 49.0 49.3 30.6 B Sector 44.6 36.3 19.2 51.2 22.1 36.3 Total average 2021.02.10 2021.03.15 2021.04.12 2021.05.11 Total of increase rate Total score A Sector -6 % 21 % -7 % -4 % 1 % -31 % 45.0 B Sector -23 % -89 % 63 % -132 % 39 % Total average -14 % -7 % -217 % 67 % 17 % 2021.01.13 46 43 55 51 49 49 45 36 19 51 22 36 45 40 37 12 36 43 0 10 20 30 40 50 60 2020.12.11 2021.01.13 2021.02.10 2021.03.15 2021.04.12 2021.05.11 Stock price rise probability score A sector B sector Total average -6% 21% -7% -4% 1% -23% -89% 63% -132% 39% -14% -7% -217% 67% 17% -250% -200% -150% -100% -50% 0% 50% 100% 2021.01.13 2021.02.10 2021.03.15 2021.04.12 2021.05.11 Increase rate of stock price rise A sector B sector Total average chong kun dang bio
- 3. 정보와 완전 정보 결 투자판단 있습니 위배 무단으 숙지하 Compliance notice ① The information provided by The Algorithm Company Analysis Consulting is obtained through reliable data and information and The Algorithm Company Analysis Program (TACAP), but its accuracy or completeness are not guaranteed. Furthermore, it may change over time.Therefore, we are not legally responsible for the results of the data provided by The Algorithm Company Analysis Consulting because of information errors or omissions. ② The Algorithm Company Analysis Consulting and all the information provided on it site are reference materials for investment decisions and the final responsibility of investment is up to users utilizing this information. ③ The Algorithm Company Analysis Consulting and its site do not do anything that violates the related laws such as discretionary transaction. ④ Users can not reallocate and recycle the information provided by The Algorithm Company Analysis Consulting firm let alone the information provided by its Site. ⑤ Be sure to know about application period of this algorithm analysis report in order to improve its accuracy. Tel : 070 - 4667 - 5009 Email : tacac@tacac.co.kr Homepage : tacac.co.kr Blog : tacac.blog.me SERVICES M&A, IPO, RECOVER, CORPORATE RESTRUCTURING, MANAGEMENT OF TECHNOLOGY, BUSINESS STRATEGY, FAMILY BUSINESS Request : http://tacac.co.kr/?page_id=1374 ① Consulting is o The Algorithm accuracy or com change over tim results of the d Consulting bec ② information pr investment dec up ③ do anything th transaction. ④ The Algorithm information pr ⑤ analysis report