amogreentech 125210 Algorithm Investment Report
•
0 likes•7 views

amogreentech 125210 Algorithm Investment Report
![[Price for scheduled purchasing]
Arbitrarily made
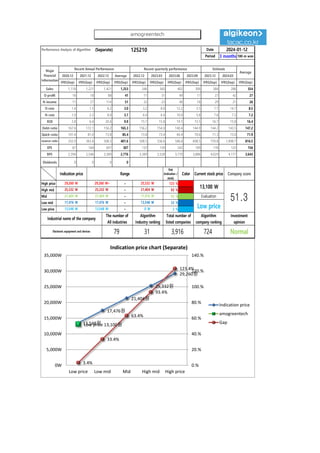
Algorithm stocks Trading Strategies (Separate) 125210 Date
Period
Gap
(Indication /
stock)
Color
low price 13,548 W 13,548 W ~ 0 W 3 % -158,367 W -12
Low mid 17,476 W 17,476 W ~ 13,548 W 33 % -1,546,737 W -89
Mid 21,404 W 21,404 W ~ 17,476 W 63 % -2,935,107 W -137
High mid 25,332 W 25,332 W ~ 21,404 W 93 % -4,323,476 W -171
Suggested Purchase
Amount 4,630,255 W
Number of stocks
purchased 353
Indication price Range Buying / Selling Buying / Selling [Stocks]
High price 29,260 W 29,260 W~ ~ 25,332 W 123 % -5,711,846 W All selling
2024-01-12
3 months
Current stock price Evaluation
Stock price rise
probability score
Investment opinion Prospective purchase amount
13,100 W Low price 48.2 Normal 10,000,000 W
Stock price rise
probability score
A Sector 48.9 49.0 46.2 44.1 47.1 48.9
48.2
B Sector 17.1 23.8 44.1 44.1 40.4 17.9
Total average 33.0 36.4 39.4 30.0 43.8 33.4
2023.08.11 2023.09.11 2023.10.16 2023.11.13 2023.12.11 2024.01.11
2023.10.16 2023.11.13 2023.12.11 2024.01.11
Total of
increase rate
Total score
A Sector 0 % -6 % -5 % 6 % 4 %
-3 % 48.3
B Sector 28 % 27 % 26 % -9 % -126 %
Total average 9 % 8 % -31 % 31 % -31 %
2023.09.11
0% -6% -5%
6% 4%
28% 27% 26%
-9%
-126%
9% 8%
-31%
31%
-31%
-150%
-100%
-50%
0%
50%
2023.09.11 2023.10.16 2023.11.13 2023.12.11 2024.01.11
Increase rate of stock price rise
A sector
B sector
Total average
amogreentech
49 49
46 44
47 49
17
24
33
44
40
18
33
36
39
30
44
33
0
10
20
30
40
50
60
2023.08.11 2023.09.11 2023.10.16 2023.11.13 2023.12.11 2024.01.11
Stock price rise probability score
A sector
B sector
Total average](data:image/gif;base64,R0lGODlhAQABAIAAAAAAAP///yH5BAEAAAAALAAAAAABAAEAAAIBRAA7)
Recommended
Recommended
More Related Content
Similar to amogreentech 125210 Algorithm Investment Report
Similar to amogreentech 125210 Algorithm Investment Report (20)
More from 알고리즘 기업분석 컨설팅-알기컨,algikeon
More from 알고리즘 기업분석 컨설팅-알기컨,algikeon (20)
Recently uploaded
Recently uploaded (20)
amogreentech 125210 Algorithm Investment Report
- 1. Performance Analysis of Algorithm (Separate) 125210 Date Period 3 months 100-m won 2020.12 2021.12 2022.12 Average 2022.12 2023.03 2023.06 2023.09 2023.12 2024.03 IFRS(Sep) IFRS(Sep) IFRS(Sep) IFRS(Sep) IFRS(Sep) IFRS(Sep) IFRS(Sep) IFRS(Sep) IFRS(Sep) IFRS(Sep) IFRS(Sep) Sales 1,118 1,221 1,421 1,253 346 360 402 308 384 286 354 O-profit 16 18 88 41 11 31 49 17 27 42 27 N-income 11 27 114 51 22 23 40 18 29 21 26 O-rate 1.4 1.5 6.2 3.0 3.2 8.6 12.2 5.5 7.1 14.7 8.5 N-rate 1.0 2.2 8.0 3.7 6.4 6.4 10.0 5.8 7.6 7.2 7.2 ROE 2.8 6.4 20.4 9.9 15.7 15.8 19.1 15.5 16.7 15.8 16.4 Debt-ratio 167.6 172.1 156.2 165.3 156.2 154.0 140.4 144.9 144.2 143.5 147.2 Quick-ratio 101.4 81.0 73.8 85.4 73.8 73.4 69.4 70.6 71.3 73.0 71.9 reserve-ratio 332.9 363.4 508.5 401.6 508.5 536.6 586.6 608.5 759.8 1,898.7 816.5 EPS 67 164 691 307 133 139 242 109 176 125 156 BPS 2,394 2,546 3,389 2,776 3,389 3,528 3,770 3,886 4,029 4,177 3,643 Dividends 0 0 0 0 2024-01-12 Major Financial Information Recent Annual Performance Recent quarterly performance Estimate Average Gap (Indication / stock) Color High price ~ 123 % High mid ~ 93 % Mid ~ 63 % Low mid ~ 33 % Low price ~ 3 % Normal 13,548 W 13,548 W 0 W Industrial name of the company The number of All industries Algorithm Industry ranking Total number of listed companies Algorithm company ranking Investment opinion Electronic equipment and devices 79 31 3,916 724 25,332 W 25,332 W 21,404 W 21,404 W 21,404 W 17,476 W Evaluation 29,260 W 29,260 W~ 25,332 W 13,100 W 51.3 17,476 W 17,476 W 13,548 W Low price Indication price Range Current stock price Company score 13,548원 17,476원 21,404원 25,332원 29,260원 Low price 13,100원 3.4% 33.4% 63.4% 93.4% 123.4% 0.% 20.% 40.% 60.% 80.% 100.% 120.% 140.% 0W 5,000W 10,000W 15,000W 20,000W 25,000W 30,000W 35,000W Low price Low mid Mid High mid High price Indication price chart (Separate) Indication price amogreentech Gap amogreentech
- 2. [Price for scheduled purchasing] Arbitrarily made Algorithm stocks Trading Strategies (Separate) 125210 Date Period Gap (Indication / stock) Color low price 13,548 W 13,548 W ~ 0 W 3 % -158,367 W -12 Low mid 17,476 W 17,476 W ~ 13,548 W 33 % -1,546,737 W -89 Mid 21,404 W 21,404 W ~ 17,476 W 63 % -2,935,107 W -137 High mid 25,332 W 25,332 W ~ 21,404 W 93 % -4,323,476 W -171 Suggested Purchase Amount 4,630,255 W Number of stocks purchased 353 Indication price Range Buying / Selling Buying / Selling [Stocks] High price 29,260 W 29,260 W~ ~ 25,332 W 123 % -5,711,846 W All selling 2024-01-12 3 months Current stock price Evaluation Stock price rise probability score Investment opinion Prospective purchase amount 13,100 W Low price 48.2 Normal 10,000,000 W Stock price rise probability score A Sector 48.9 49.0 46.2 44.1 47.1 48.9 48.2 B Sector 17.1 23.8 44.1 44.1 40.4 17.9 Total average 33.0 36.4 39.4 30.0 43.8 33.4 2023.08.11 2023.09.11 2023.10.16 2023.11.13 2023.12.11 2024.01.11 2023.10.16 2023.11.13 2023.12.11 2024.01.11 Total of increase rate Total score A Sector 0 % -6 % -5 % 6 % 4 % -3 % 48.3 B Sector 28 % 27 % 26 % -9 % -126 % Total average 9 % 8 % -31 % 31 % -31 % 2023.09.11 0% -6% -5% 6% 4% 28% 27% 26% -9% -126% 9% 8% -31% 31% -31% -150% -100% -50% 0% 50% 2023.09.11 2023.10.16 2023.11.13 2023.12.11 2024.01.11 Increase rate of stock price rise A sector B sector Total average amogreentech 49 49 46 44 47 49 17 24 33 44 40 18 33 36 39 30 44 33 0 10 20 30 40 50 60 2023.08.11 2023.09.11 2023.10.16 2023.11.13 2023.12.11 2024.01.11 Stock price rise probability score A sector B sector Total average
- 3. may ded by Compliance notice ① The information provided by The Algorithm Company Analysis Consulting is obtained through reliable data and information and The Algorithm Company Analysis Program (TACAP), but its accuracy or completeness are not guaranteed. Furthermore, it may change over time.Therefore, we are not legally responsible for the results of the data provided by The Algorithm Company Analysis Consulting because of information errors or omissions. ② The Algorithm Company Analysis Consulting and all the information provided on it site are reference materials for investment decisions and the final responsibility of investment is up to users utilizing this information. ③ The Algorithm Company Analysis Consulting and its site do not do anything that violates the related laws such as discretionary transaction. ④ Users can not reallocate and recycle the information provided by The Algorithm Company Analysis Consulting firm let alone the information provided by its Site. ⑤ Be sure to know about application period of this algorithm analysis report in order to improve its accuracy. Tel : 070 - 4667 - 5009 Email : tacac@tacac.co.kr Homepage : tacac.co.kr blog.naver.com/tacac SERVICES M&A, IPO, RECOVER, CORPORATE RESTRUCTURING, MANAGEMENT OF TECHNOLOGY, BUSINESS STRATEGY, FAMILY BUSINESS Request : http://tacac.co.kr/?page_id=1374