Download as PDF, PPTX


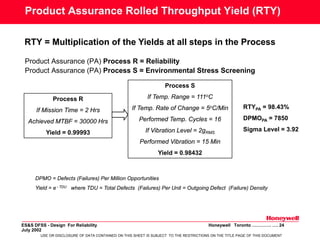
![Screening Strength Estimation
The Screening Strength of a given stress screen profile is defined as the
probability that the stress screen will precipitate a latent defect into a
detectable failure, given that a defect is present. Screening provide
assurance on the Outgoing Reliability
Screening Strength for Temperature Cycling (STn) is a function of Temperature Range =T;
Temp. Rate of Change =R; Number of Cycles =n
STn
= 1 − e[−[0.0017⋅(T + 0.6)
0.6
⋅ln(e + R ) ⋅n]]
3
Screening Strength for Random Vibration (SVt) is a function of G = gRMS; Vibration Duration = t
SVt
= 1 − e[−(0.0046⋅G
1.71
⋅t )]
Combined Screen Strength (SS) = 1 - (1-STn).(1-SVt)
When T = 111oC; R = 5oC/Min
n =16 Cyc; G = 2gRMS;
t = 15 Min
SS = 0.98432
The Screening Strength equations were developed by Hughes Aircraft Company, and modified by Rome Air
Development Centre (RADC) based on the data from McDonnel Aircraft Co. and Grumman Aerospace
Corporation
ES&S DFSS - Design For Reliability
July 2002
Honeywell Toronto …………. …. 21
USE OR DISCLOSURE OF DATA CONTAINED ON THIS SHEET IS SUBJECT TO THE RESTRICTIONS ON THE TITLE PAGE OF THIS DOCUMENT](https://image.slidesharecdn.com/designforreliability1-140208115704-phpapp01/85/Design-For-Reliability-21-320.jpg)


The document discusses various techniques for designing products for reliability, including derating components, accelerated life testing, and reliability estimation methods. It describes how reliability modeling should guide the design process from the beginning to design out potential failure mechanisms. The goal is to develop longer-lived products through an iterative approach of testing, analyzing failures, and redesigning to improve reliability. Key aspects of a reliability-focused design process include understanding failure mechanisms, developing reliability databases, and using super-accelerated life testing techniques.