This document reviews reliability prediction methods for electronic devices. It classifies common methods into three categories: bottom-up statistical methods using failure data, top-down similarity analysis methods based on external failure databases, and bottom-up physics-of-failure methods. Several specific methods are described in detail, including how they calculate failure rates at the component and board level using statistical models or physical failure models. The methods each have advantages and limitations in addressing objectives like determining reliability requirements or providing inputs for safety analysis. A combined use of the methods is recommended to best manage reliability over the product development process.
![A review of reliability prediction methods for electronic devices
B. Foucher a,*, J. Boulliee a,1
, B. Meslet b,2
, D. Das b,3
a
EADS CCR, 12, rue Pasteur BP76, 92152 Suresnes Cedex, France
b
CALCE Electronic Products and Systems Center, University of Maryland, College Park, MD 20740, USA
Received 24 August 2000; received in revised form 21 December 2001
Abstract
A wide range of reliability prediction methods is available today for electronic systems. This article classifies the
commonly used and referred to reliability prediction methodologies into some categories easy to understand. A set of
selected methods, which are of relevance to many industries, the aerospace industry among others, are reviewed and the
possibility they offer to address the stated objectives is assessed. Their respective advantages and shortcomings are the
basis for the recommendation we make to use the methods in a combined fashion (simultaneously or successively) along
the product development process.
Ó 2002 Elsevier Science Ltd. All rights reserved.
1. Introduction
The nature of the need for a reliability prediction
method varies according to the product development
stage (e.g., design, development or manufacturing) and
its related reliability metric. Some of the objectives are
listed here [1,2].
• determine if a reliability requirement is achievable,
• help to achieve a reliable design that meets end-user
reliability and safety requirements with justification
for the requirements,
• help to achieve a reliable manufacturing process,
• assess potential warranty risks,
• provide inputs to safety analysis,
• establish baseline for logistic support requirements
(e.g., maintenance, spares, upgrades).
Several methods have been developed to address
these objectives but no unique method can address all
the objectives [3]. This paper reviews several methods
used in the industry and assesses how they fulfill the
aforementioned objectives.
First, the selected methods are presented and then
discussed. Next, they are rated according to a list of
criteria that are representative of an ideal method. Fi-
nally, a comparative table summarizing our viewpoint
regarding the management of the objectives is suggested.
2. The concepts for reliability prediction
Table 1 lists the most common reliability prediction
methods and their latest update. These methods have
been grouped into three types:
• bottom–up statistical methods (BS),
• top–down similarity analysis methods based on ex-
ternal failure database (TD),
• bottom–up physics-of-failure methods (BP).
The first two types use statistical analysis of failure
data while the last one refers to the use of physics-of-
failure (PoF) models. There had been several articles
on the merits and demerits of the statistical methods
of reliability predictions [1,4–9]. This article clarifies
the different conditions for application of these meth-
odologies.
Microelectronics Reliability 42 (2002) 1155–1162
www.elsevier.com/locate/microrel
*
Corresponding author. Fax: +33-1-46-97-30-08.
E-mail addresses: bruno.foucher@eads.net (B. Foucher),
digudas@calce.umd.edu (D. Das).
1
J. Boulliee is now with Alcatel Space Industries (Toulouse,
France).
2
B. Meslet is now at Yonsei University (Seoul, Korea).
3
Fax: +1-301-314-9269.
0026-2714/02/$ - see front matter Ó 2002 Elsevier Science Ltd. All rights reserved.
PII: S0026-2714(02)00087-2](https://image.slidesharecdn.com/foucher2002-181107051823/85/Foucher2002-1-320.jpg)
![A review of reliability prediction methods for electronic devices
B. Foucher a,*, J. Boulliee a,1
, B. Meslet b,2
, D. Das b,3
a
EADS CCR, 12, rue Pasteur BP76, 92152 Suresnes Cedex, France
b
CALCE Electronic Products and Systems Center, University of Maryland, College Park, MD 20740, USA
Received 24 August 2000; received in revised form 21 December 2001
Abstract
A wide range of reliability prediction methods is available today for electronic systems. This article classifies the
commonly used and referred to reliability prediction methodologies into some categories easy to understand. A set of
selected methods, which are of relevance to many industries, the aerospace industry among others, are reviewed and the
possibility they offer to address the stated objectives is assessed. Their respective advantages and shortcomings are the
basis for the recommendation we make to use the methods in a combined fashion (simultaneously or successively) along
the product development process.
Ó 2002 Elsevier Science Ltd. All rights reserved.
1. Introduction
The nature of the need for a reliability prediction
method varies according to the product development
stage (e.g., design, development or manufacturing) and
its related reliability metric. Some of the objectives are
listed here [1,2].
• determine if a reliability requirement is achievable,
• help to achieve a reliable design that meets end-user
reliability and safety requirements with justification
for the requirements,
• help to achieve a reliable manufacturing process,
• assess potential warranty risks,
• provide inputs to safety analysis,
• establish baseline for logistic support requirements
(e.g., maintenance, spares, upgrades).
Several methods have been developed to address
these objectives but no unique method can address all
the objectives [3]. This paper reviews several methods
used in the industry and assesses how they fulfill the
aforementioned objectives.
First, the selected methods are presented and then
discussed. Next, they are rated according to a list of
criteria that are representative of an ideal method. Fi-
nally, a comparative table summarizing our viewpoint
regarding the management of the objectives is suggested.
2. The concepts for reliability prediction
Table 1 lists the most common reliability prediction
methods and their latest update. These methods have
been grouped into three types:
• bottom–up statistical methods (BS),
• top–down similarity analysis methods based on ex-
ternal failure database (TD),
• bottom–up physics-of-failure methods (BP).
The first two types use statistical analysis of failure
data while the last one refers to the use of physics-of-
failure (PoF) models. There had been several articles
on the merits and demerits of the statistical methods
of reliability predictions [1,4–9]. This article clarifies
the different conditions for application of these meth-
odologies.
Microelectronics Reliability 42 (2002) 1155–1162
www.elsevier.com/locate/microrel
*
Corresponding author. Fax: +33-1-46-97-30-08.
E-mail addresses: bruno.foucher@eads.net (B. Foucher),
digudas@calce.umd.edu (D. Das).
1
J. Boulliee is now with Alcatel Space Industries (Toulouse,
France).
2
B. Meslet is now at Yonsei University (Seoul, Korea).
3
Fax: +1-301-314-9269.
0026-2714/02/$ - see front matter Ó 2002 Elsevier Science Ltd. All rights reserved.
PII: S0026-2714(02)00087-2](https://image.slidesharecdn.com/foucher2002-181107051823/75/Foucher2002-1-2048.jpg)
![2.1. Bottom–up statistical methods
BS methods use prediction models developed from
statistical curve fitting of component failure data, which
may have been collected in the field, in laboratory or
from manufacturers. The assumption is made that sys-
tem or equipment failure causes are inherently linked to
components whose failures are independent of each
other.
The models used in BS methods are mainly based on
two types: ‘‘parts count analysis’’ and ‘‘parts stress
analysis’’. As shown in the examples given in Table 2,
‘‘parts count analysis’’ models assume that the com-
ponent operates under typical operating conditions,
whereas ‘‘parts stress analysis’’ models require an input
of the parameters that are included in the models of the
component failure rate, k [5].
The factors for failure rate calculations follow:
• kG, ka are generic or average failure rates (or base
failure rates) depending on the device complexity
and technology,
• PQ, PL are quality and device factors depending
respectively on the quality of the device as stated
by inspection and on the time the device has been
manufactured,
• C1, C2 are failure rate constants depending on the de-
vice complexity (circuit, technology, package and pin
count),
• In CNET, PB, PT and Ps are respectively package
technology factor, technology and function factor
and package pin count factor,
• Pt in CNET and PT in Mil-Hdbk-217 are tempera-
ture acceleration factors (steady state operating tem-
perature),
• PV is a voltage stress factor depending on the ratio of
applied voltage to the rated voltage of the component,
• PE is an environmental factor depending on a tabu-
lated description of the environment.
These models may be detailed as in the last project of
CNET, known as RDF2000, where models have been
defined for boards and hybrid circuits as well. The
model for microcircuit is now [13]:
k ¼ kdie þ kpackage þ koverstress ð5Þ
where
ð1Þ kdie ¼ ðk1NeÀ0:35a
þ k2ÞRðPtsÞ ð6Þ
Table 1
Non-exhaustive list of assessed reliability prediction methods and their latest updates
BS SAEa
reliability prediction method 1987
Mil-Hdbk-217 [10] 1995
Telcordia SR-332 [11] 1997
CNETb
RDF-93 [12] 1993
Corrected 1999
CNET RDF-2000 [13] 2000
British Telecom 1995
HRD-5 [14]
Siemens SN29500 [15] 1999
NTTc
procedure [16] 1985
Reliability Analysis Center 2000
PRISM [17]
TD Honeywell In-Service Reliability Assessment Program (HIRAP) similarity analysis method [18], [19] 1999
REMM Reliability Enhancement Methodology and Modelling [20] 2001
DERAd
Transport Reliability Assessment and Calculation System (TRACS) [21] 1999
BP Airbus–Giat use of manufacturer testing results [22], [23] 1999
CADMP, calcePWA, calceFAST (CALCE EPSCe
, University of Maryland) software [24], [25], [26] 2001
a
Society of Automotive Engineers (USA).
b
Centre National d’Etude des Teeleecommunications (France).
c
Nippon Telephone Telegraph (Japan).
d
Defence Evaluation and Research Agency (UK Ministry of Defence) – now renamed to DSTL and QinetiQ.
e
Computer Aided Life Cycle Engineering (CALCE) Electronic Products and Systems Center (USA).
Table 2
Examples of models used in BS methods for microcircuits
Parts count k ¼ kGPQPL (1)
(Mil-Hdbk-217)
k ¼ kaPQ (2)
(CNET)
Parts stress k ¼ ðC1PT þ C2PEÞPQPL (3)
(Mil-Hdbk-217F)
k ¼ ðC1PtPTPV þ C2PBPEPsÞPLPQ (4)
(CNET)
1156 B. Foucher et al. / Microelectronics Reliability 42 (2002) 1155–1162](https://image.slidesharecdn.com/foucher2002-181107051823/85/Foucher2002-2-320.jpg)
![with
• k1, base failure rate per transistors,
• N, number of transistor,
• a, manufacturing year minus 1998 (base year),
• k2, failure rate depending on technology know-how,
• RðPtsÞ, sum of all the temperature factors (Pt) times
the time (s) during which this particular temperature
is reached.
ð2Þ kpackage ¼ 2:75 Â 10À3
PaðRPnDs0:68
Þk3 ð7Þ
with
• Pa, thermal expansion coefficient difference factor,
• Pn, thermal cycle factor depending on the number of
yearly cycles of the said Ds,
• Ds, amplitude of one thermal variation,
• k3, package base failure rate.
(3) koverstress ¼ 0, when the microcircuit is not an interface
circuit, otherwise
koverstress ¼ kEOS ð8Þ
with kEOS, failure constant for electrical discharges
(electrical over stress) depending on the application field.
Some users modify BS reliability models with a cor-
rective multiplicative factor. This factor is derived from
the user’s experience through proprietary field or test
data.
Another evolution of these BS methods is the PRISM
software where the global model is similar to RDF2000
(k ¼ kdie þ kpackage þ koverstress). PRISM includes terms for
failure rates from temperature cycling and solder joint
but treats those contributions as constant failure rate
without justification. This method also offers the possi-
bility to make a simple similarity analysis, to use field
experience databases and to weight the overall quality
factor with ‘‘Process Grading factors’’. These factors
depend on components, design, manufacturing, supply
chain, mechanical fatigue, management, and analysis
tools. This is a mix of methods with the implementation
of top–down similarity analysis.
Once the failure rate of each component has been
computed, the reliability of the board is calculated by
summing up all k. In both the models discussed in this
article (Mil-Hdbk-217 and RDF2000), a constant failure
rate is associated with the connections and assemblies
weighed up by the thermal cycles undergone during the
life.
2.2. Top–down similarity analysis methods
Top–down similarity analysis methods based on
proprietary databases (TD) use similarity analysis be-
tween previous systems or sub-systems with a known
level of reliability and newly designed systems.
All failure causes, and not only component failure
rates, are considered and therefore, failure cause analysis
is of the utmost importance.
A typical TD approach is summarized by the fol-
lowing steps [18,19]:
• collection of failure data from the field,
• assessment of field data (particularly equipment/
board failure causes, calculation of the associated re-
liability),
• determination of failure rates at the circuit card as-
sembly (CCA) level, based on the number of unique
CCAs per equipment,
• determination of the failure rates at the piece part
and interconnect levels based on the number of piece
parts and interconnects per CCA,
• determination of the failure rates for equipment/
board failure causes not related to piece parts and
interconnects,
• creation of the in-service failure rate database with all
previous pieces of information according to the fol-
lowing physical model categories: passives (low/high
complexity), interconnections, semiconductor (low/
high complexity), manufacturing process, design pro-
cess, other failure causes,
• comparison of existing to proposed designs or simi-
larity process with the following steps:
review products for which field data is available,
identify characteristic differences (e.g., design,
manufacturing, and so on),
quantify the impact of the characteristic differ-
ences on each physical model category,
incorporate field data (percent of each physical
model category, overall end item or assembly fail-
ure rates),
compute the new item (board, CCA or equip-
ment) failure rate according to:
k ¼ kp
Xn
a¼1
ðDa  FadÞ ð9Þ
where kp is the field failure rate for the predecessor
item, Da is the distribution percentage for physical
model category a, Fa is the difference factor between
the new and previous items for category a, and n is
the total number of physical model categories.
Other TD methods also use the knowledge of reli-
ability experts to assess and weight the different inputs
[21].
2.3. Bottom-up physics-of-failure methods
BP methods requires comprehensive knowledge of
the thermal, mechanical, electrical and chemical life
B. Foucher et al. / Microelectronics Reliability 42 (2002) 1155–1162 1157](https://image.slidesharecdn.com/foucher2002-181107051823/85/Foucher2002-3-320.jpg)
![cycle environment as well as processes leading to failures
in the field in order to apply appropriate failure models.
The first method [22,23] uses the manufacturer’s re-
liability data test results (highly accelerated stress test,
temperature humidity bias, temperature cycling, . . .) at
the components level.
These data are computed with the help of statistical
laws (Weibull, v2
) with confidence levels generally set at
60%. From these failure rates, appropriate acceleration
models are applied to derive component failure rates
applicable to the life cycle.The acceleration models are
the following:
• Arrhenius’s law for temperature:
AF ¼ exp
Ea
k
1
T1
À
1
T2
ð10Þ
where, AF is the acceleration factor, Ea is the acti-
vation energy of the failure mechanism, k is the
Boltzman constant, T1 and T2 are the temperature of
use and stress respectively.
• Voltage acceleration:
AF ¼ expðbðV2 À V1ÞÞ ð11Þ
where, AF is the acceleration factor, b is a constant
depending on technology, V1 and V2 are the voltages
of use and stress respectively.
• Gunn’s law for humidity:
AF ¼ expðbðRH2 À RH1ÞÞ ð12Þ
where, AF is the acceleration factor, b ¼ 0:08, RH1
and RH2 are the humidity level of use and stress re-
spectively.
• Coffin–Manson based law for thermal cycling fa-
tigue:
AF ¼
DT2
DT1
2
F1
F2
0:33
ð13Þ
where, AF is the acceleration factor, DT1 and DT2 are
the amplitude of thermal variations of use and stress
respectively, F1 and F2 are the frequency of the use
and stress cycles respectively.
The component failure rate is the sum of all the
failure rates (thermal, humidity, voltage, thermal cy-
cling). The board failure rate is the sum of all the failure
rate of the components.
The highest level of BP methods (CALCE software)
predicts the time to failure of board or component by
targeting the most common failure mechanisms at var-
ious sites of the component or assembly. Required in-
formation includes material characteristics, geometry,
environmental, and operational loads. The failure
mechanisms and associated failure models used for as-
sembly analysis are
• Thermo-mechanical solder joint fatigue (1st order)
Dc ¼ F
LD
h
DaDTe ð14Þ
This is the Engelmaier model for Surface mount
packages where, Dc is the shear strain range, F is a
correction factor, LD is the component length, h is the
solder joint height, Da is the thermal expansion co-
efficient (CTE) difference between component and
board, DTe is the thermal cycle range.
The damage is then assessed by
Nf ¼
1
2
Dc
2ef
1=c
ð15Þ
where Nf is the number of cycles to failure, Dc is the
calculated shear strain range, 2f is the fatigue ductility
coefficient (f is the strain to fracture), c is the fatigue
ductility exponent (material characteristic).
Other second-order strain (as well as damage) models
or Finite Element Models exist for more complex
packages like BGA (Ball Grid Array).
• Vibration solder joint fatigue
Z0 ¼
9:8 Gin
f 1:5
n
ð16Þ
This is the Steinberg model where, Z0 is the maximum
displacement of the board, Gin is the board acceleration
input, fn is the first natural frequency of the board.
The damage is then assessed by Basquin’s relation-
ship:
ZNb
f ¼ constant ð17Þ
where Z is the board out-of-plane displacement, Nf is the
number of cycles to failure, b is a solder joint material
characteristic.
This relationship can be written in the following
form:
Nf ¼ Nf0
Z0
Z
b
ð18Þ
where Nf is the unknown number of failures for the ap-
plied Z, Nf0
is the number of cycles to failure for Z0––
displacement associated with first natural frequency.
A cumulative analysis may also be led through the
implementation of Miner’s rule:
Nf ¼
0:7
fv=fth
Nv
þ
1
Nth
ð19Þ
where Nf is the solder joint fatigue life, Nv (Nth) is the
number of vibration (thermal) cycles to failure, fv (fth) is
the frequency of vibration (thermal) cycles.
1158 B. Foucher et al. / Microelectronics Reliability 42 (2002) 1155–1162](https://image.slidesharecdn.com/foucher2002-181107051823/85/Foucher2002-4-320.jpg)
![The reliability of a board is the reliability of the
weakest point on the board with the associated failure
site (or location), mode, and mechanism identified.
Similarly, the same method is used at the component
level [25,26].
3. Discussion on the methods
The discussion focuses on the following areas: the
sources of the data, the inputs, the sensitivity of the
models and the outputs.
Table 3 lists the sources of data and original envi-
ronment of all the methods listed previously. The more
generic the sources of data and the environment they
come from, the better. However, each method considers
the environment differently: BS methods use environ-
mental and load fitted factors (for operating mode with
or without storage) based on failure modes (not causes)
whereas BP methods use load profiles.
This comes from the fact that the environment for the
BS methods derives from the failure databases that may
be hampered by the following issues:
• a large amount of experimental data is required to set
up representative fittings,
• these fittings become pessimistic over time because of
data aging and component reliability improvement:
HRD-5 and PRISM for example are designed to take
this reliability improvement into account but HRD-5
is insensitive to the component technology,
• new technologies are conservatively dealt with, al-
though PRISM and CNET latest issues tend to ad-
dress this problem,
• extrinsic (e.g. EOS) and intrinsic (e.g. oxide weak-
ness) failures are mixed and are used to get an ag-
gregate figure without mathematical or physical
justification.
Similarly, TD methods need a regular updating of
their failure in-service databases, which depends on the
companies policies and investments. Eventually, all
removals need to be analyzed, failures tracked down and
failure rates stored for each cause of failures at each level
(item, equipment, board, component).
For the Airbus–Giat method, manufacturers’ reliabil-
ity results are needed and their relevance must be checked.
The inputs to the methods are summarized in Table 4.
As far as BS methods are concerned, PRISM is somewhat
different and allows for further inputs of a different kind:
an assessment of the design, manufacturing, supply and
testing processes at system or sub-system level may be
used to mitigate the overall results (process grading).
Similarly, PRISM also allows the direct input of envi-
ronmental and operational parameters (temperature cy-
cling, shock, relative humidity and vibration frequencies).
However, in most cases with BS methods, the result
reflects the reliability of the components, which are no
longer the main contributors to the system reliability due
to quality improvement and system increased complex-
ity [27,28] (system level failures are overlooked).
Results with TD methods could be refined by a large
use of tests and field data.
BP methods like CALCE software need a detailed
knowledge of information, which might be considered as
proprietary by manufacturers. These methods also re-
quire significant time resources. A prior knowledge of
failure mechanisms of failed products is also needed to
choose models geared to actual failure mechanisms.
Similarly, there is an extensive selection of operational
and environmental parameters, which also proves to be
an advantage to ‘‘customize’’ the method.
The elements that measure the sensitivity of the
models are the next issue to be discussed.
Table 3
Sources of data and environment of the reliability prediction
methods
Method Sources of data environment
MIL-Hdbk-217 Military
Telcordia SR-332 Telecom
CNET Ground Military
RDF-93 and 2000 Civil Equipment
SAE Reliability Prediction
method
Automotive
BT-HRD-5 Telecom
Siemens SN29500 Siemens products
NTT procedure Telecom
PRISM Commercial––Military
HIRAP Commercial aviation
REMM Automotive––Military
TRACS Military vehicles
Airbus–Giat method Not specifica
CALCE software Not specific
a
The validation has only been made on avionics for active
components.
Table 4
Inputs to the different reliability prediction methods
Method Inputs
BS Part types, count and quality level
Application environment
System configuration
TD Failure rates of several similar items
Characteristic differences
BP Material properties
Design characteristics
Assembly techniques
Usage environment
Functional loads
B. Foucher et al. / Microelectronics Reliability 42 (2002) 1155–1162 1159](https://image.slidesharecdn.com/foucher2002-181107051823/85/Foucher2002-5-320.jpg)
![In BS methods, the temperature influence is simpli-
fied by the use of Arrhenius’s equation: the influence
of thermal gradients and ramp rates are downplayed.
Furthermore, the sensitivity to operational and envi-
ronmental parameters varies among the methods [5,29]
and the predictions are optimistic or pessimistic de-
pending on the application: the appropriate method
should hence be carefully selected.
However, the models account for a great deal of
components (integrated circuits, capacitors, resistors,
transistors, diodes, thyristors, mechanical and electro-
mechanical devices) and their implementation is easy
to use.
PRISM has once again another feature: a similarity
analysis based on identified failure causes could be led
using collected field data.
This is halfway from TD methods, which models
account for internal design and manufacturing failures
at a higher level (board, equipment or system).
As far as BP methods are concerned, a difference shall
be made between Airbus–Giat and CALCE methods.
The former considers only intrinsic failures and does
consider manufacturing process variations (through
manufacturers’ data), whereas the latter overlooks in-
trinsic failures (the electronic function is not described)
nor does it consider manufacturing process variation.
Otherwise, common characteristics are
• new technologies are not penalized by models,
• models are product-independent (only dependent on
materials),
• overstress environmental conditions are not consid-
ered.
CALCE method has also some specific patterns:
there is an extensive choice of stress and damage models
(e.g., depending on packages) and the failure mecha-
nisms are limited to those mainly responsible today for
field failure return (assembly solder joint).
The outputs of the methods are quite different. BS
methods provide the user with an average failure rate of
the average production. Failures are considered to occur
randomly and failure rate is therefore considered as
constant. This means that screening is assumed efficient
enough for the components to reach the constant fail-
ure rate domain (NTT, HRD-5, Mil-Hdbk-217). Some
models, however, allow refinement of the failure rate in
case of an insufficient screening (Telcordia, Siemens,
SAE and RDF). The main features of such an output
are listed below:
• no failure mechanism is characterized,
• no confidence level is provided,
• an estimate of the probability of the success of the
mission is available for further calculation (e.g.,
maintenance, spare parts),
• no time is given as to when an equipment should be
replaced,
• uncertainties remain as to which components are crit-
ical [29].
TD methods output a failure rate, which is moni-
tored over time (a constant failure rate is assumed in
HIRAP). This failure rate is an average of a given
production. Failure causes are identified but no confi-
dence level is provided.
The outputs from BP methods differ between Airbus–
Giat and CALCE methods. The former delivers an av-
erage failure rate of a given production. The knowledge
of failure modes is extensive and specific through the
manufacturer’s data. Furthermore, some data on the
confidence level are given. However, this is limited to a
component and board level computation and accelera-
tion models should be carefully selected [30].
The latter of the two methods delivers a time to failure
for the component/board. Failure site, mode, and mech-
anism are identified, which allow for improvements. This
figure is, however, limited to component or board and
inputs on the distributions on material, geometry and
environment is required to obtain confidence level on
the results. Furthermore, the use of this time-to-failure
metric is not yet included in many traditional availabil-
ity, maintenance, or safety assessment tools.
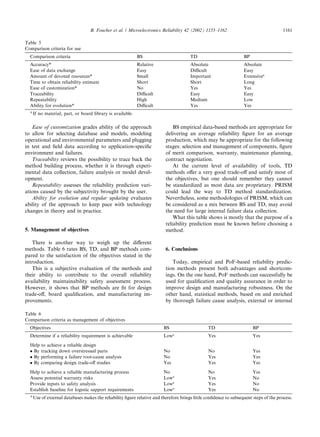
4. Comparison criteria and assessment
According to our discussion, Table 5 rates subjec-
tively the characteristics of these methods in view of a set
of criteria deemed appropriate. As can be seen no single
method addresses all criteria comprehensively: tradeoffs
need to be made between the models usability and the
required amount of detailed information.
Not all these criteria bear the same significance.
Number one, three, five, and eight (marked by an aster-
isk) seem to be more important to be achieved. Therefore,
it clearly appears that TD as well as BP methods should
be recommended for their intrinsic characteristics.
Accuracy addresses the meaning of the calculated reli-
ability figure. Relative implies that only a comparison
can be performed whereas absolute means that the ap-
proachintentistoprovideanumbertypicaloftheproduct.
Ease of data exchange grades ability of the approach
to allow cross-industrial comparisons of obtained figures
and use of databases and models.
Amount of devoted resources evaluates the material
and human resources (e.g., software, test equipment,
failure analysis equipment) necessary to adequately per-
form the reliability prediction process.
Time to obtain reliability estimate evaluates the
amount of time necessary to adequately perform the
reliability prediction process.
1160 B. Foucher et al. / Microelectronics Reliability 42 (2002) 1155–1162](https://image.slidesharecdn.com/foucher2002-181107051823/85/Foucher2002-6-320.jpg)
![database and similarity analysis, are fit for rapid as-
sessment and may supply helpful figures for further steps
including safety analysis, warranty risk management,
and field support.
The tables given in this paper will help to define
• what can be told from the methods used by designers
or suppliers,
• which method to use depending on the predefined ob-
jectives.
It is our belief that the best reliability prediction
could only be achieved by a combined use of differ-
ent methods, depending on the design, development or
manufacturing phase. A specific reliability figure is of
less concern compared to the confidence in the effective
reliability level of the product to be sold. The use made
of the reliability prediction concepts should also be co-
herent, i.e., based on sound principles, explained to the
customer throughout the whole process. This is what is
intended in new reliability standards such as IEEE 1413
or SAE J1000. The description of which method is to be
used at a given product development stage, the expla-
nation of the reasons why this method is used and the
delivery of the results associated to the various applied
methods along the process will insure that the reliability
requirements have been met.
References
[1] Denson W. Rebuttal to: A critique of the Reliability-
Analysis-Center failure-rate-model for plastic encapsulated
microcircuits. IEEE Trans Reliab 1998;47(4):419–24.
[2] SAE G-11 Committee, Aerospace information report on
reliability prediction methodologies for electronic equip-
ment AIR5286, Electronic reliability prediction sub-com-
mittee, 31/01/98.
[3] Pecht M, Ramakrishnan A. Development and activities of
the IEEE reliability standards group. J Reliab Eng Assoc
Jpn 2000;22(8):699–706.
[4] Sinnadurai N, Shukla A, Pecht M. A critique of the
Reliability-Analysis-Center failure-rate-model for plastic
encapsulated microcircuits. IEEE Trans Reliab 1998;
47(2):110–3.
[5] Bowles J. A survey of reliability prediction procedures for
microelectronic devices. IEEE Trans Reliab 1992;41(1):
2–12.
[6] Leonard C. On US Mil-Hdbk-217 and reliability predic-
tion. IEEE Trans Reliab 1988;37:450–1.
[7] Leonard C. Failure prediction methodology calculations
can mislead: use them wisely, not blindly. Proceedings
of the National Aerospace and Electronics Conference
NAECON 1989;4:1248–53.
[8] Wong KL. What is wrong with the existing reliability
prediction methods? Qual Reliab Eng Int 1990;6(4):251–7.
[9] Wong KL. A change in direction for reliability engineering
is long overdue. IEEE Trans Reliab 1993;42:261.
[10] United States Department of Defense, US Mil-Hdbk-217.
Reliability Prediction of Electronic Equipment, version F,
1995.
[11] Telcordia Technologies Special Report SR-332, Reliability
Prediction Procedure for Electronic Equipment, Issue 1,
Telcordia Customer Service, Piscataway, N. J., May 2001.
[12] Centre National d’Etude des Teeleecommunications. Hand-
book of Reliability Data for Electronic Components RDF-
93 English Issue, 1993.
[13] UTEC 80810. Modeele universel pour le calcul de la fiabilitee
preevisionnelle des composants, cartes et eequipements
eelectroniques––RDF2000, (projet du 11/01/00).
[14] British Telecom, Handbook of Reliability Data, HDR-5,
1995.
[15] Siemens AG, Siemens Company Standard SN29500, Ver-
sion 6.0, Failure Rates of Electronic Components, Sie-
mens Technical Liaison and Standardization, 9 November
1999.
[16] Nippon Telegraph and Telephone Corporation, Standard
Reliability Table for Semiconductor Devices, 1985.
[17] Denson W. A tutorial: PRISM. Reliab Analysis Center
1999;3rd quarter:1–6.
[18] Gullo L. In-service reliability assessment and top-down ap-
proach provides alternative reliability prediction method.
Ann Reliab Maintain Symp Proc 1999:365–77.
[19] Johnson B, Gullo L. Improvements in reliability assess-
ment and prediction methodology. Ann Reliab Maintain
Symp Proc 2000:181–7.
[20] Internet website www.remm.org/REMM. Last modified 16
February 2001.
[21] Internet website www.agena.co.uk/tracs. Last modified 11
August 1999.
[22] Charpenel P et al. An other way to assess electronics part
reliability. Microelectronics Reliability, Proceedings ES-
REF 1997;37(10/11):1449–1452.
[23] Charpenel P, Cavernes P, Casanovas V. A new prediction-
methodology on avionics embedded electronics: why? how?
Ann Reliab Maintain Symp Proc 1999:378–82.
[24] Osterman M, Stadterman T. Failure assessment software
for circuit card assemblies. Ann Reliab Maintain Symp
Proc 1999:269–76.
[25] McCluskey P. Fatigue and intermetallic formation in lead
free solder die attach. Proceedings of IPACK’01, The
Pacific Rim/ASME International Electronic Packaging
Technical Conference and Exhibition, paper #44592,
9–13 July 2001. p. 1–7.
[26] McCluskey P. A web-based graduate course on the
mechanical design of high temperature and high power
electronics. Proceedings of the electronic component and
technology conference, 30 May 2001. p. 397–400.
[27] Pecht M, Ramappan V. Are components still a major
problem? A review of electronic systems and device field
failure returns. IEEE Trans Comp Hybr Manufact Tech-
nol 1992;15(6):1160–4.
[28] Denson W. The history of reliability prediction. IEEE
Trans Reliab 1998;47(3-SP):321–8.
[29] Jones J, Hayes J. A comparison of electronic reliability
prediction models. IEEE Trans Reliab 1999;48(2):127–34.
[30] Pecht MG, Shukla AA, Kelkar N, Pecht J. Criteria for the
assessment of reliability models. IEEE Trans Comp
Packag Manufact Technol B 1997;20(3):229–33.
1162 B. Foucher et al. / Microelectronics Reliability 42 (2002) 1155–1162](https://image.slidesharecdn.com/foucher2002-181107051823/85/Foucher2002-8-320.jpg)