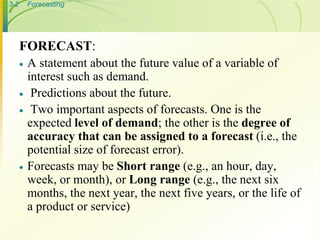
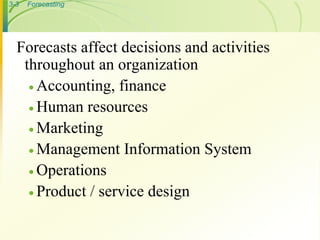
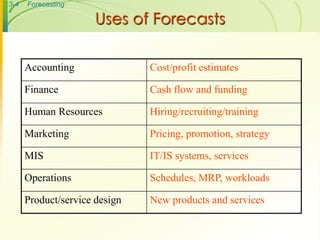
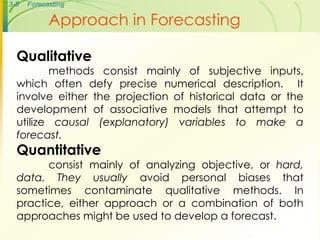
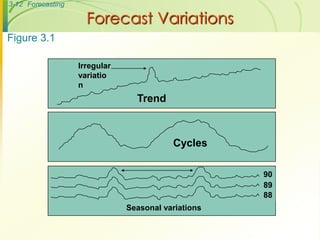
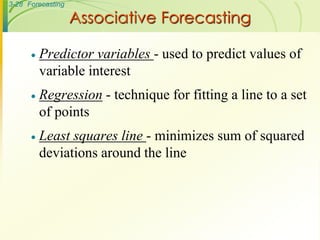
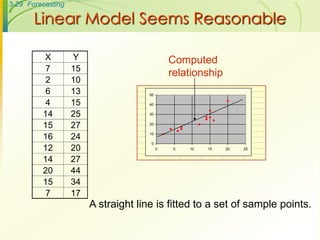
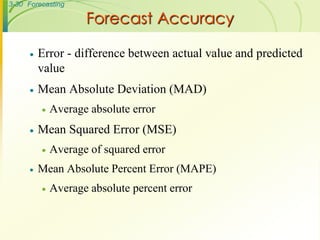
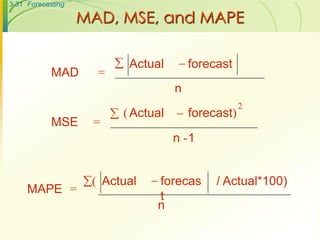
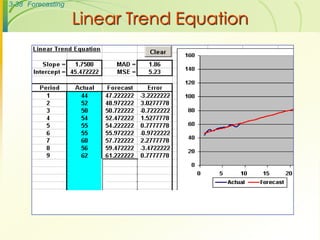
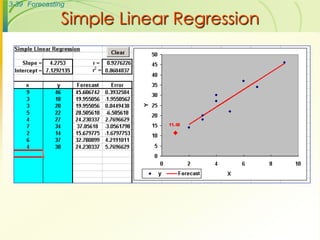
The document summarizes key concepts about forecasting from the 8th edition of the textbook "Operations Management" by William J. Stevenson. It discusses definitions of forecasting, the importance and uses of forecasts in various business functions. Methods of forecasting include qualitative judgmental forecasts, quantitative time series analysis, and associative models using explanatory variables. Specific forecasting techniques covered include naive forecasts, moving averages, exponential smoothing, trend analysis, and regression. The document also addresses evaluating forecast accuracy and controlling forecasts.
2. 3-2 Forecasting
FORECAST:
A statement about the future value of a variable of
interest such as demand.
Predictions about the future.
Two important aspects of forecasts. One is the
expected level of demand; the other is the degree of
accuracy that can be assigned to a forecast (i.e., the
potential size of forecast error).
Forecasts may be Short range (e.g., an hour, day,
week, or month), or Long range (e.g., the next six
months, the next year, the next five years, or the life of
a product or service)
3. 3-3 Forecasting
Forecasts affect decisions and activities
throughout an organization
Accounting, finance
Human resources
Marketing
Management Information System
Operations
Product / service design
4. 3-4 Forecasting
Accounting Cost/profit estimates
Finance Cash flow and funding
Human Resources Hiring/recruiting/training
Marketing Pricing, promotion, strategy
MIS IT/IS systems, services
Operations Schedules, MRP, workloads
Product/service design New products and services
Uses of Forecasts
5. 3-5 Forecasting
Assumes causal system
past ==> future
Forecasts rarely perfect because of
randomness
Forecasts more accurate for
groups vs. individuals
Forecast accuracy decreases
as time horizon increases
I see that you will
get an A this semester.
7. 3-7 Forecasting
Steps in the Forecasting Process
Step 1 Determine purpose of forecast
Step 2 Establish a time horizon
Step 3 Select a forecasting technique
Step 4 Gather and analyze data
Step 5 Prepare the forecast
Step 6 Monitor the forecast
“The forecast”
8. 3-8 Forecasting
Approach in Forecasting
Qualitative
methods consist mainly of subjective inputs,
which often defy precise numerical description. It
involve either the projection of historical data or the
development of associative models that attempt to
utilize causal (explanatory) variables to make a
forecast.
Quantitative
consist mainly of analyzing objective, or hard,
data. They usually avoid personal biases that
sometimes contaminate qualitative methods. In
practice, either approach or a combination of both
approaches might be used to develop a forecast.
9. 3-9 Forecasting
Types of Forecasts
Judgmental - uses subjective inputs
Time series - uses historical data
assuming the future will be like the
past
Associative models - uses
explanatory variables to predict the
future
10. 3-10 Forecasting
Judgmental Forecasts
Executive opinions
Sales force opinions
Consumer surveys
Outside opinion
Delphi method
Opinions of managers and staff
Achieves a consensus forecast
11. 3-11 Forecasting
Time Series Forecasts
Trend - long-term movement in data
Seasonality - short-term regular variations in
data
Cycle – wavelike variations of more than one
year’s duration
Irregular variations - caused by unusual
circumstances
Random variations - caused by chance
13. 3-13 Forecasting
Naive Forecasts
Uh, give me a minute....
We sold 250 wheels last
week.... Now, next week
we should sell....
The forecast for any period equals
the previous period’s actual value.
14. 3-14 Forecasting
Simple to use
Virtually no cost
Quick and easy to prepare
Data analysis is nonexistent
Easily understandable
Cannot provide high accuracy
Can be a standard for accuracy
Naïve Forecasts
17. 3-17 Forecasting
Moving Averages
Moving average – A technique that averages a
number of recent actual values, updated as new
values become available.
Weighted moving average – More recent values in a
series are given more weight in computing the
forecast.
MAn =
n
Aii = 1
n
18. 3-18 Forecasting
Simple Moving Average
MAn =
n
Aii = 1
n
35
37
39
41
43
45
47
1 2 3 4 5 6 7 8 9 10 11 12
Actual
MA3
MA5
19. 3-19 Forecasting
Exponential Smoothing
• Premise--The most recent observations might
have the highest predictive value.
Therefore, we should give more weight to the
more recent time periods when forecasting.
Ft = Ft-1 + (At-1 - Ft-1)
20. 3-20 Forecasting
Exponential Smoothing
Weighted averaging method based on previous
forecast plus a percentage of the forecast error
A-F is the error term, is the % feedback
Ft = Ft-1 + (At-1 - Ft-1)
24. 3-24 Forecasting
Linear Trend Equation
Ft = Forecast for period t
t = Specified number of time periods
a = Value of Ft at t = 0
b = Slope of the line
Ft = a + bt
0 1 2 3 4 5 t
Ft
26. 3-26 Forecasting
Linear Trend Equation Example
t y
Week t2
Sales ty
1 1 150 150
2 4 157 314
3 9 162 486
4 16 166 664
5 25 177 885
t = 15 t2
= 55 y = 812 ty = 2499
(t)
2
= 225
27. 3-27 Forecasting
Linear Trend Calculation
y = 143.5 + 6.3t
a =
812 - 6.3(15)
5
=
b =
5 (2499) - 15(812)
5(55) - 225
=
12495-12180
275-225
= 6.3
143.5
28. 3-28 Forecasting
Associative Forecasting
Predictor variables - used to predict values of
variable interest
Regression - technique for fitting a line to a set
of points
Least squares line - minimizes sum of squared
deviations around the line
29. 3-29 Forecasting
Linear Model Seems Reasonable
A straight line is fitted to a set of sample points.
0
10
20
30
40
50
0 5 10 15 20 25
X Y
7 15
2 10
6 13
4 15
14 25
15 27
16 24
12 20
14 27
20 44
15 34
7 17
Computed
relationship
30. 3-30 Forecasting
Forecast Accuracy
Error - difference between actual value and predicted
value
Mean Absolute Deviation (MAD)
Average absolute error
Mean Squared Error (MSE)
Average of squared error
Mean Absolute Percent Error (MAPE)
Average absolute percent error
31. 3-31 Forecasting
MAD, MSE, and MAPE
MAD =
Actual forecast
n
MSE =
Actual forecast)
-1
2
n
(
MAPE =
Actual forecas
t
n
/ Actual*100)(
33. 3-33 Forecasting
Controlling the Forecast
Control chart
A visual tool for monitoring forecast errors
Used to detect non-randomness in errors
Forecasting errors are in control if
All errors are within the control limits
No patterns, such as trends or cycles, are
present
34. 3-34 Forecasting
Sources of Forecast errors
Model may be inadequate
Irregular variations
Incorrect use of forecasting technique
35. 3-35 Forecasting
Tracking Signal
Tracking signal =
(Actual-forecast)
MAD
•Tracking signal
–Ratio of cumulative error to MAD
Bias – Persistent tendency for forecasts to be
Greater or less than actual values.
36. 3-36 Forecasting
Choosing a Forecasting Technique
No single technique works in every situation
Two most important factors
Cost
Accuracy
Other factors include the availability of:
Historical data
Computers
Time needed to gather and analyze the data
Forecast horizon