
Recommended
More Related Content
What's hot
What's hot (20)
Similar to Aaj ka trend 11.07.16
Similar to Aaj ka trend 11.07.16 (18)
Recently uploaded
Recently uploaded (20)
Aaj ka trend 11.07.16
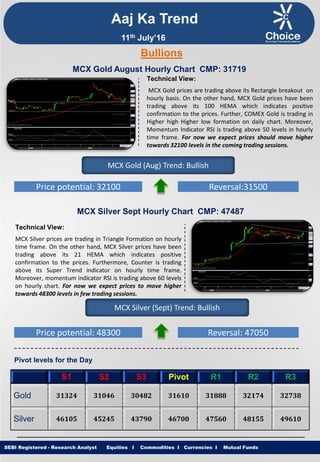
- 1. Equities I Commodities I Currencies I Mutual Funds Aaj Ka Trend Technical View: MCX Gold prices are trading above its Rectangle breakout on hourly basis. On the other hand, MCX Gold prices have been trading above its 100 HEMA which indicates positive confirmation to the prices. Further, COMEX Gold is trading in Higher high Higher low formation on daily chart. Moreover, Momentum Indicator RSI is trading above 50 levels in hourly time frame. For now we expect prices should move higher towards 32100 levels in the coming trading sessions. SEBI Registered - Research Analyst Equities I Commodities I Currencies I Mutual Funds Bullions MCX Gold August Hourly Chart CMP: 31719 MCX Gold (Aug) Trend: Bullish Price potential: 32100 Reversal:31500 MCX Silver Sept Hourly Chart CMP: 47487 Technical View: MCX Silver prices are trading in Triangle Formation on hourly time frame. On the other hand, MCX Silver prices have been trading above its 21 HEMA which indicates positive confirmation to the prices. Furthermore, Counter is trading above its Super Trend indicator on hourly time frame. Moreover, momentum indicator RSI is trading above 60 levels on hourly chart. For now we expect prices to move higher towards 48300 levels in few trading sessions. MCX Silver (Sept) Trend: Bullish Price potential: 48300 Reversal: 47050 Pivot levels for the Day S1 S2 S3 Pivot R1 R2 R3 Gold 31324 31046 30482 31610 31888 32174 32738 Silver 46105 45245 43790 46700 47560 48155 49610 11th July’16
- 2. Equities I Commodities I Currencies I Mutual Funds Technical View: MCX Copper prices are trading in Falling channel Formation on hourly chart. On daily chart, the MCX Copper price has completed a “Bearish SHARK Harmonic Pattern” at 337.10 levels. Furthermore, prices have been trading below its 50 HEMA on hourly chart. Moreover, Counter is trading below its Super Trend indicator on hourly time frame. On the other hand, momentum indicator RSI is trading below 40 levels on hourly chart. For now we expect prices to move lower towards 310 levels in coming trading sessions. SEBI Registered - Research Analyst Equities I Commodities I Currencies I Mutual Funds MCX Copper June hourly Chart CMP: 317.80 MCX Copper (June) Trend: Bearish Price potential: 310 Reversal: 323 MCX Crude Oil July. Hourly Chart CMP: 3059 Technical View: MCX Crude Oil as expected traded on the lower side and achieved our short term target at 3020 levels. MCX Crude Oil prices has witnessed Rising channel Breakdown at 3141 levels on 4 hours chart. On the other hand prices have been trading below its 21 HEMA on MCX Crude Oil hourly chart. Moreover, Momentum indicator RSI has shown Bearish range shift on daily chart. For now we expect prices to move lower towards 2980 levels in coming trading sessions. MCX Crude Oil (July) Trend: Bearish Price potential: 2980 Reversal: 3110 Pivot levels for the Day S1 S2 S3 Pivot R1 R2 R3 Copper 317.5 316.0 312.5 319.4 320.9 322.9 326.3 Crude 3002 2968 2886 3050 3084 3132 3214 Base Metal Energy Aaj Ka Trend 11th July’16
- 3. Equities I Commodities I Currencies I Mutual FundsSEBI Registered - Research Analyst Equities I Commodities I Currencies I Mutual Funds Other Base Metals & Energy S1 S2 S3 Pivot R1 R2 R3 Trend Copper 317.5 316.0 312.5 319.4 320.9 322.9 326.3 Aluminum 110.7 109.9 108.4 111.3 112.1 112.8 114.2 Lead 120.9 119.8 117.3 122.3 123.4 124.8 127.3 Nickel 653.6 643.1 625.2 661.0 671.5 678.9 696.8 Zinc 141.7 139.8 136.5 143.0 145.0 146.3 149.5 Natural Gas 185.4 183.2 178.6 187.8 190.0 192.4 197.0 Fundamental News: Gold fell slightly on Thursday, taking a brief pause from its scorching, post-Brexit winning streak, as a favorable payroll indicator sent a strong harbinger for a critical U.S. jobs report at week's end. Gold slipped in Asia on Friday as the market awaited direction from U.S. nonfarm payrolls data. Gold prices slid lower on Friday, as investors awaited the highly-anticipated U.S. employment report due later in the day, but the precious metal remained close to Wednesday’s two-year peak as concerns over the global impact of the Brexit vote continued to dampen sentiment. Crude oil rebounded in Asia on Friday as investors bought after sharp dips overnight and ahead of U.S. rig count data from Baker Hughes and nonfarm payrolls in the U.S. Crude prices bounced back on Friday from two-month lows hit in the previous session, but benchmark Brent was in line for its largest weekly decline since January as bearish economic indicators weighed on oil. Oil Friday recovered from sharp overnight losses on disappointing official U.S. crude stocks data. U.S. oil futures bounced off two-month lows on Friday, but gains were expected to remain limited as Thursday’s disappointing U.S. crude oil inventories report and post-Brexit concerns continued to weigh. The United States is seeking trade sanctions against India after winning a dispute at the World Trade Organization regarding Indian restrictions on imports of U.S. poultry meat, eggs and live pigs, the WTO said on Friday. The top-performing high-yield bond exchange-traded fund is betting big that energy companies will not be deadbeats. Aaj Ka Trend 11th July’16
- 4. Equities I Commodities I Currencies I Mutual FundsSEBI Registered - Research Analyst Equities I Commodities I Currencies I Mutual Funds International Market Commodity Closing Price Gold 1367.55 Silver 20.32 Crude Oil 45.16 Brent Crude Oil 46.56 Natural Gas 2.817 COMEX/NYMEX/ICE ( Precious Metals & Energy) Currency & Commodity Index Currency (Spot) Current Price USD / INR 67.14 Dollar Index 96.31 EUR / USD 1.1050 CRB Index* 187.17 Closing as on 08.07.16 *Closing as on 08.07.16 LME (Base Metals) ( $ per tones) Commodity Closing Price Copper 4710 Aluminum 1663 Zinc 2142 Lead 1812 Nickel 9880 SHFE (Base Metals) (Yuan per tones) Commodity Closing Price Copper 36570 Aluminum 12615 Zinc 16650 Lead 12900 Closing as on 08.07.16 Closing as on 08.07.16 LME INVENTORY DATA Aaj Ka Trend 01-July-16 04-July-16 06-July-16 07-July-16 08-July-16 Aluminium -5750 -7025 -6825 -5925 -5775 Copper -2400 -725 10525 -1825 2500 Lead -75 -75 -350 -100 -125 Nickel -228 -1452 -1266 636 -936 Zinc -475 -600 -350 -950 -575 11th July’16
- 5. Equities I Commodities I Currencies I Mutual Funds This is solely for information of clients of Choice Broking and does not construe to be an investment advice. It is also not intended as an offer or solicitation for the purchase and sale of any financial instruments. Any action taken by you on the basis of the information contained herein is your responsibility alone and Choice Broking its subsidiaries or its employees or associates will not be liable in any manner for the consequences of such action taken by you. We have exercised due diligence in checking the correctness and authenticity of the information contained in this recommendation, but Choice Broking or any of its subsidiaries or associates or employees shall not be in any way responsible for any loss or damage that may arise to any person from any inadvertent error in the information contained in this recommendation or any action taken on basis of this information. Technical analysis studies market psychology, price patterns and volume levels. It is used to forecast future price and market movements. Technical analysis is complementary to fundamental analysis and news sources. The recommendations issued herewith might be contrary to recommendations issued by Choice Broking in the company research undertaken as the recommendations stated in this report is derived purely from technical analysis. Choice Broking has based this document on information obtained from sources it believes to be reliable but which it has not independently verified; Choice Broking makes no guarantee, representation or warranty and accepts no responsibility or liability as to its accuracy or completeness. The opinions contained within the report are based upon publicly available information at the time of publication and are subject to change without notice. The information and any disclosures provided herein are in summary form and have been prepared for informational purposes. The recommendations and suggested price levels are intended purely for trading purposes. The recommendations are valid for the day of the report however trading trends and volumes might vary substantially on an intraday basis and the recommendations may be subject to change. The information and any disclosures provided herein may be considered confidential. Any use, distribution, modification, copying, forwarding or disclosure by any person is strictly prohibited. The information and any disclosures provided herein do not constitute a solicitation or offer to purchase or sell any security or other financial product or instrument. The current performance may be unaudited. Past performance does not guarantee future returns. There can be no assurance that investments will achieve any targeted rates of return, and there is no guarantee against the loss of your entire investment. POTENTIAL CONFLICT OF INTEREST DISCLOSURE (as on date of report) Disclosure of interest statement – • Analyst interest of the stock /Instrument(s): - No. • Firm interest of the stock / Instrument (s): - No. Disclaimer Contact Us Amit Pathania Research Associate amit.pathania@choiceindia.com Rohan Patil Research Associate rohan.patil@choiceindia.com www.choiceindia.comcustomercare@choiceindia.com SEBI Registered - Research Analyst Equities I Commodities I Currencies I Mutual Funds Aaj Ka Trend 11th July’16 Neeraj Yadav Research Advisor neeraj.yadav@choiceindia.com Anish Vyas Senior Research Associate anish.vyas@choiceindia.com Amit Pathania Digitally signed by Amit Pathania DN: cn=Amit Pathania, o=Choice Equity Broking Pvt. ltd, ou=Research Department, email=amit.pathania@choiceindia.com, c=IN Date: 2016.07.11 08:48:54 +05'30'