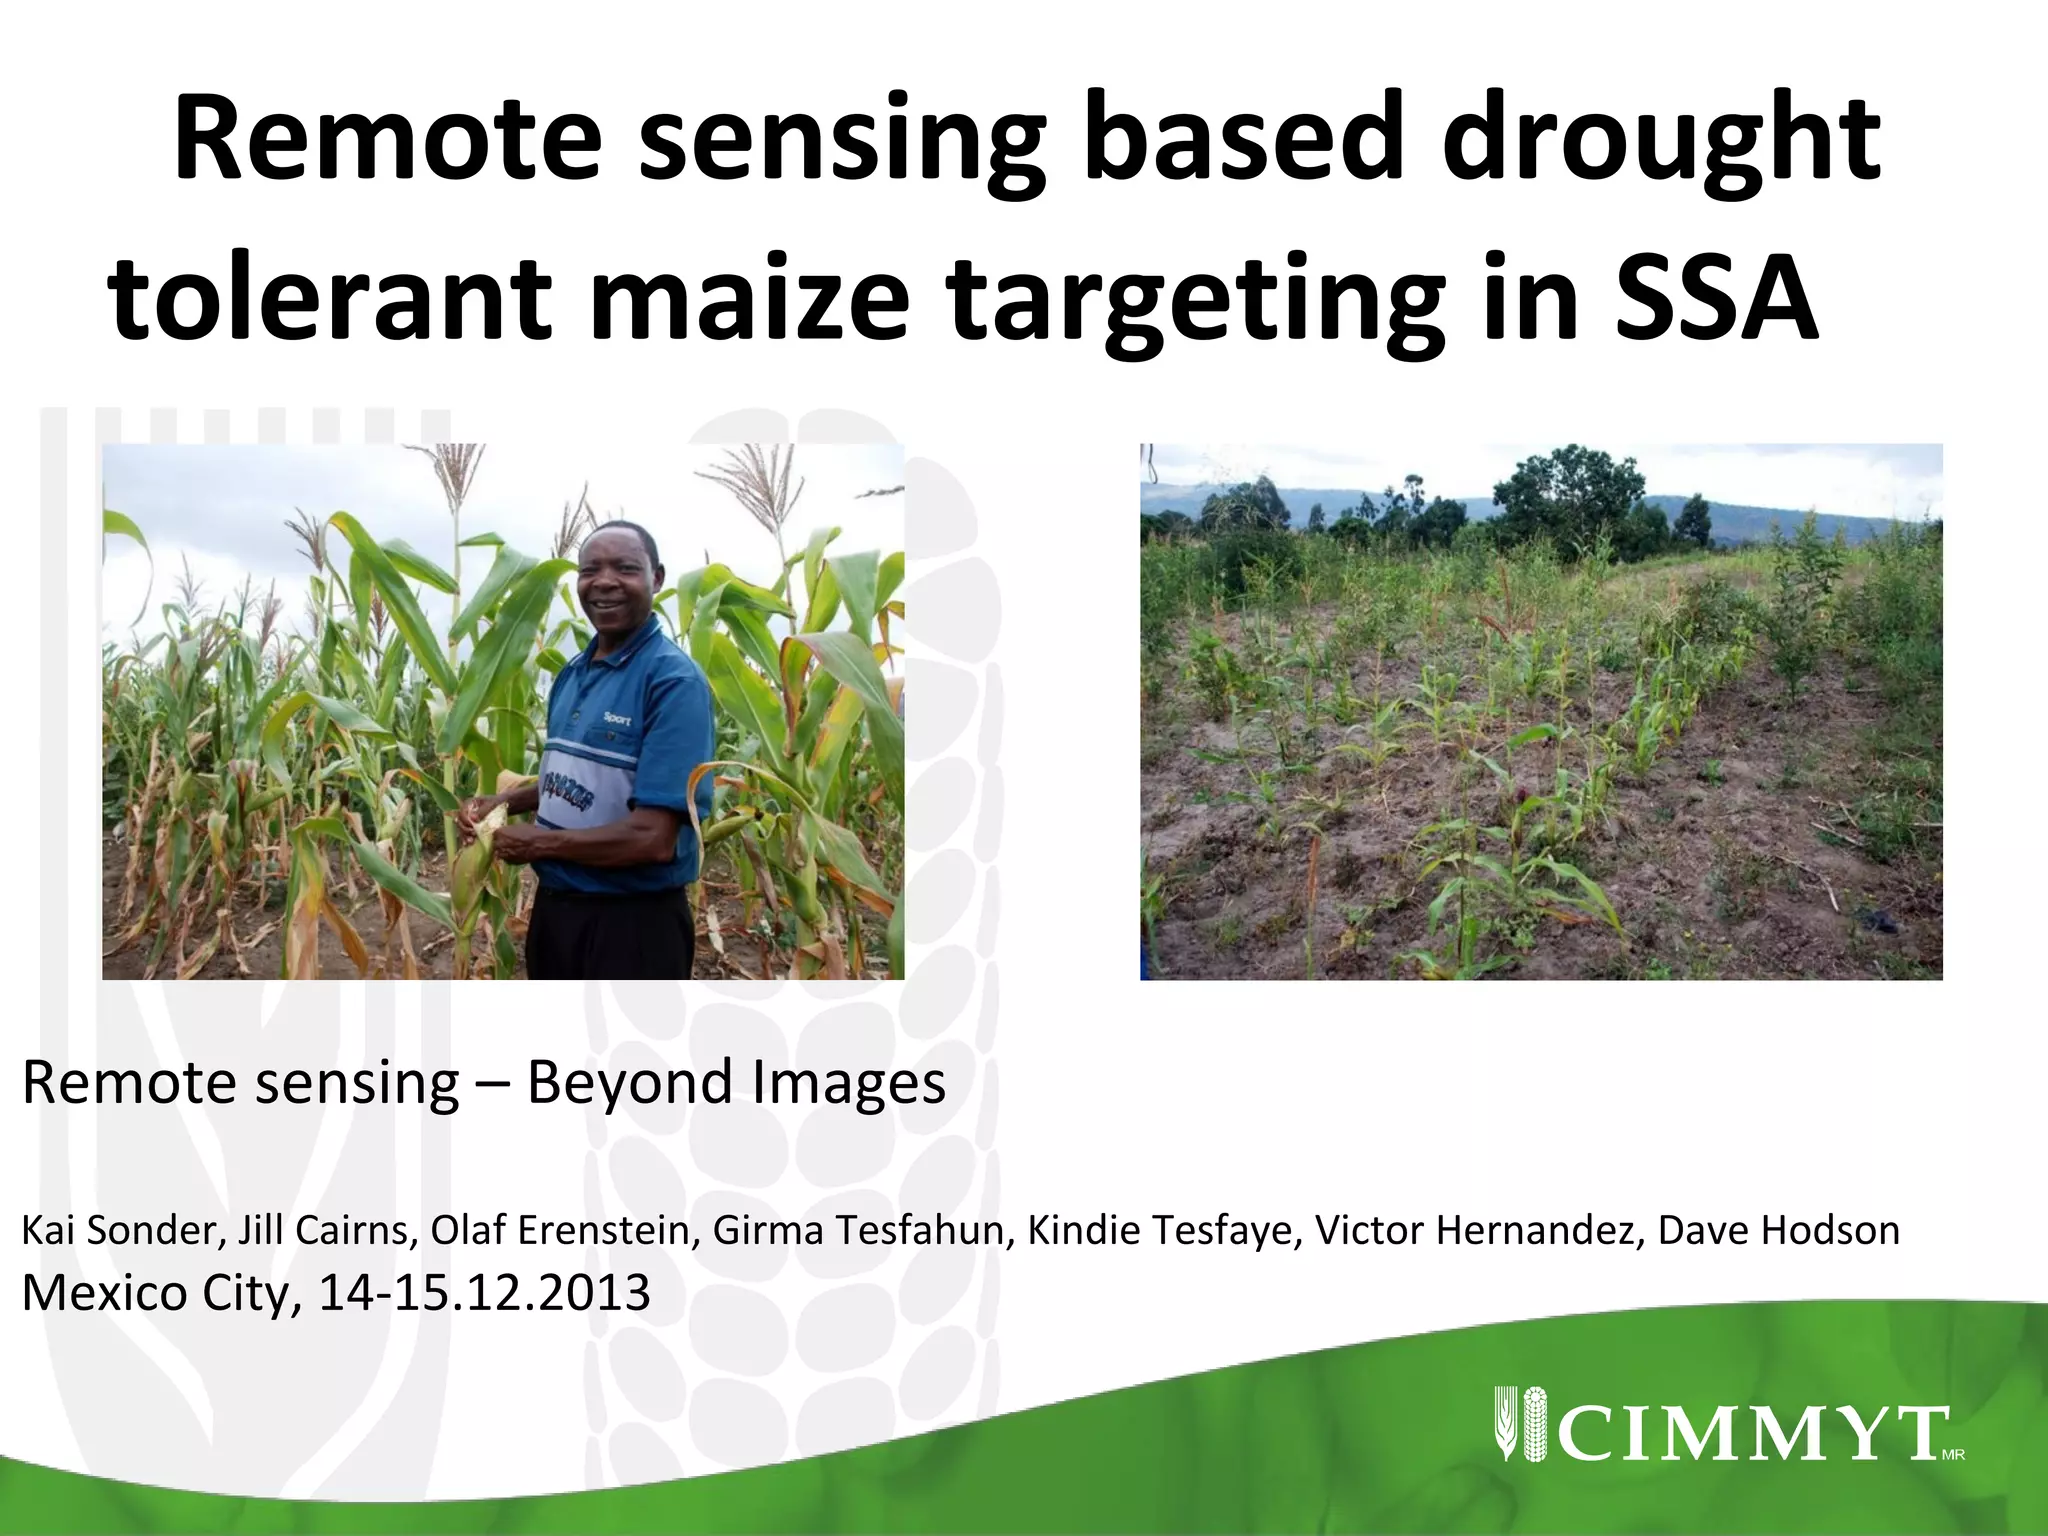
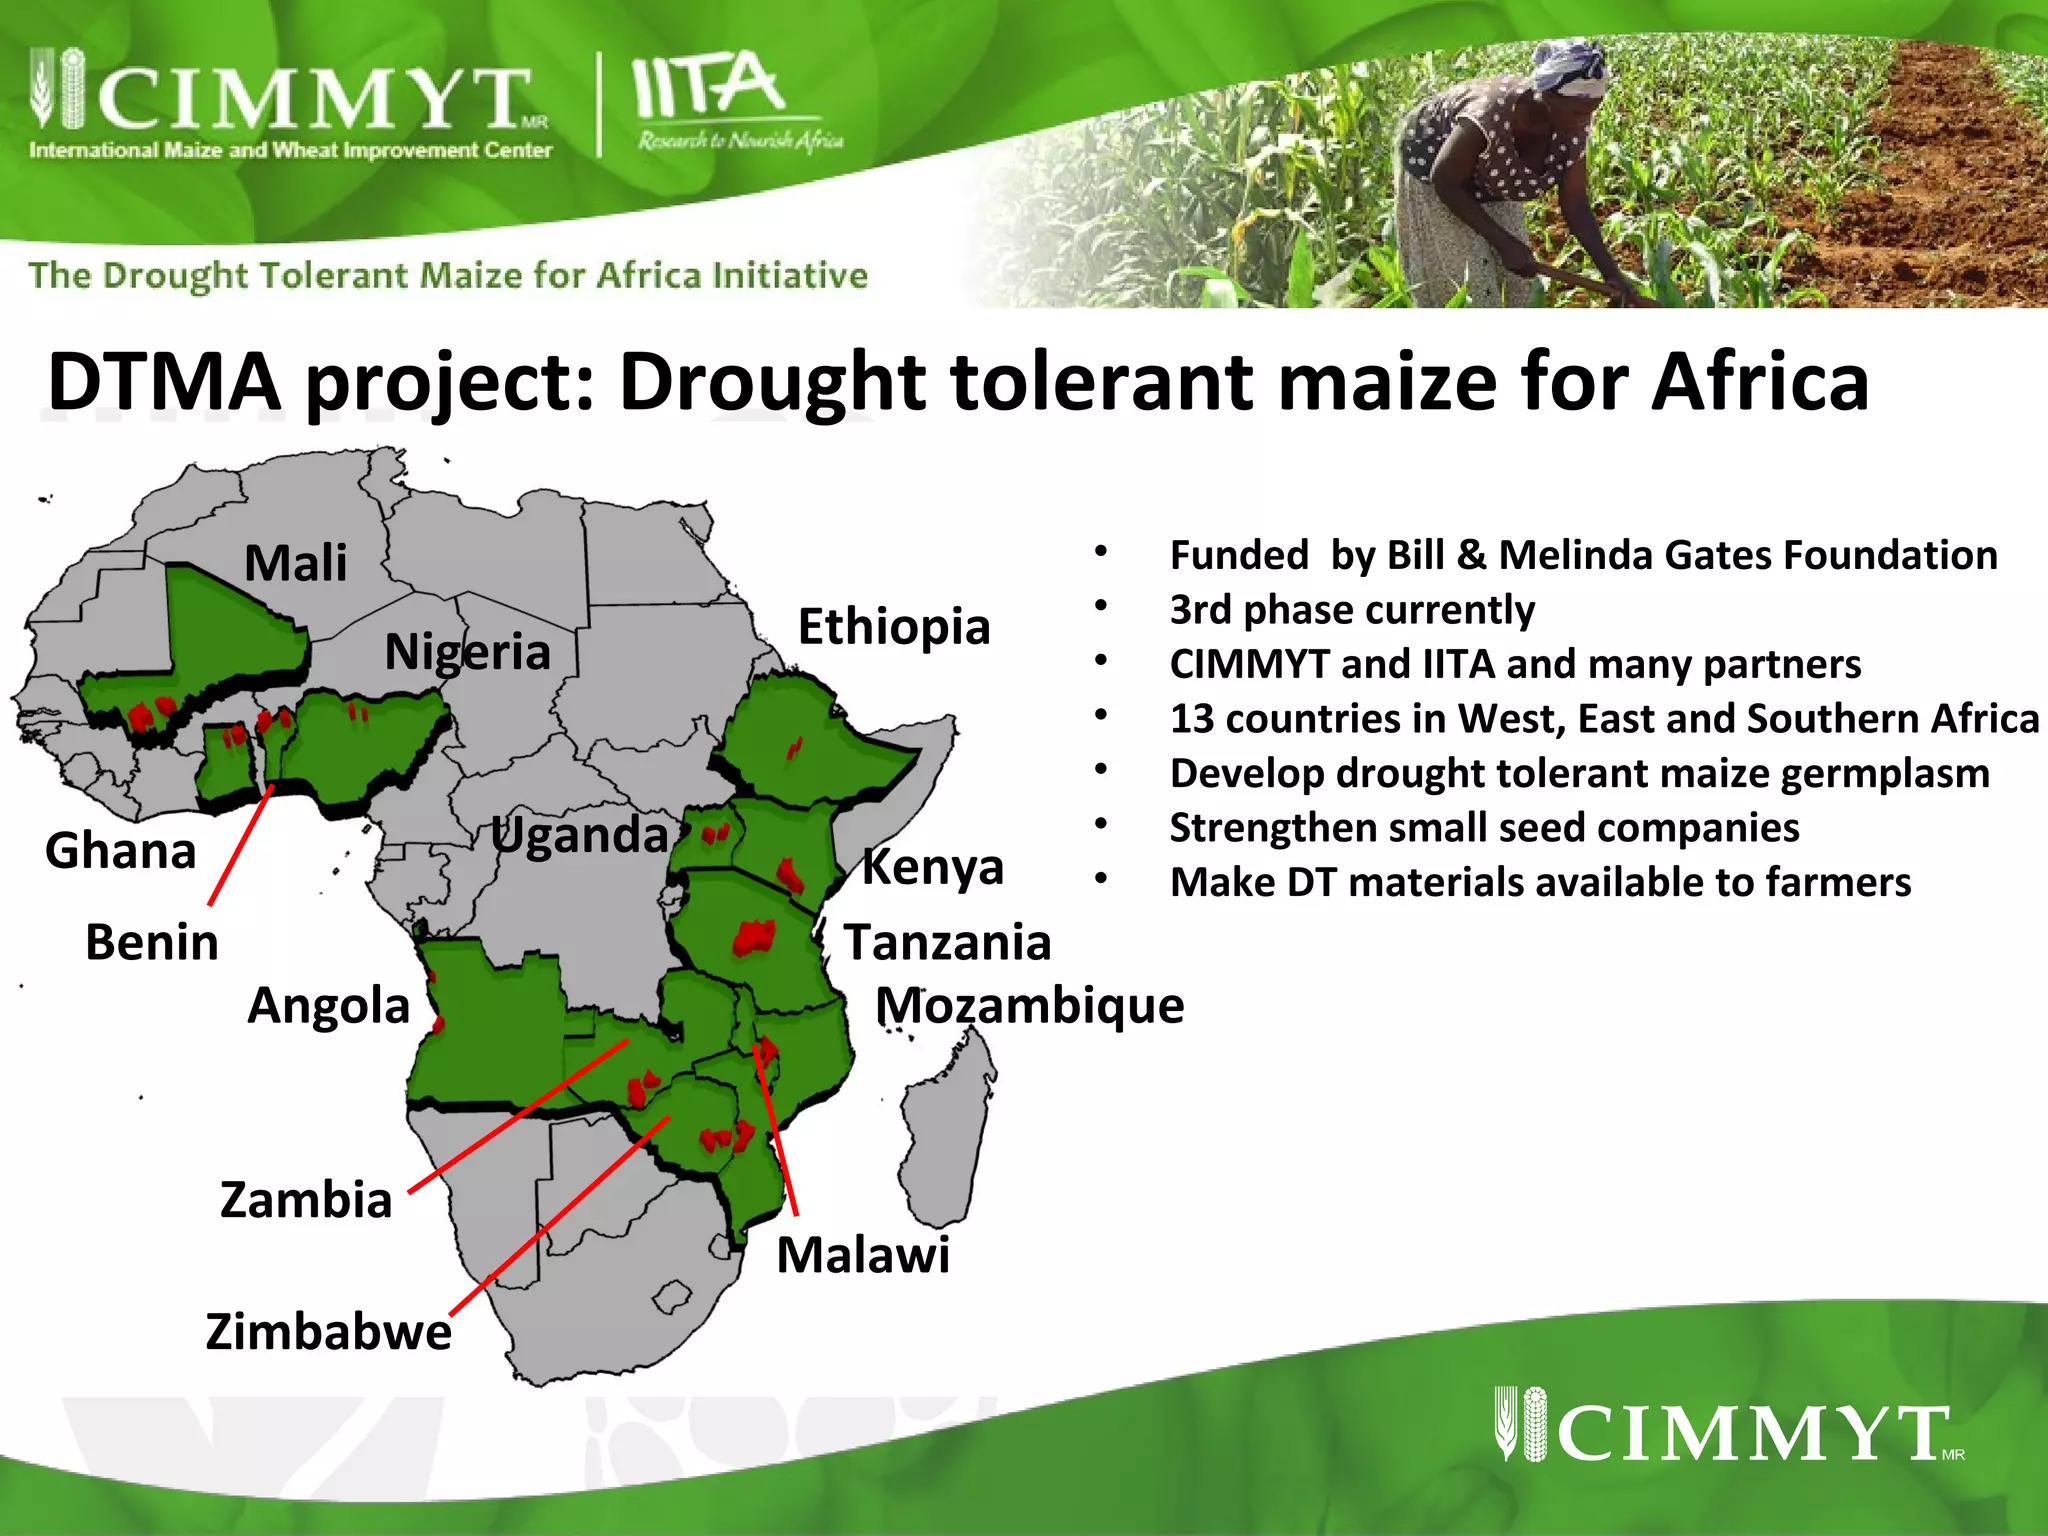
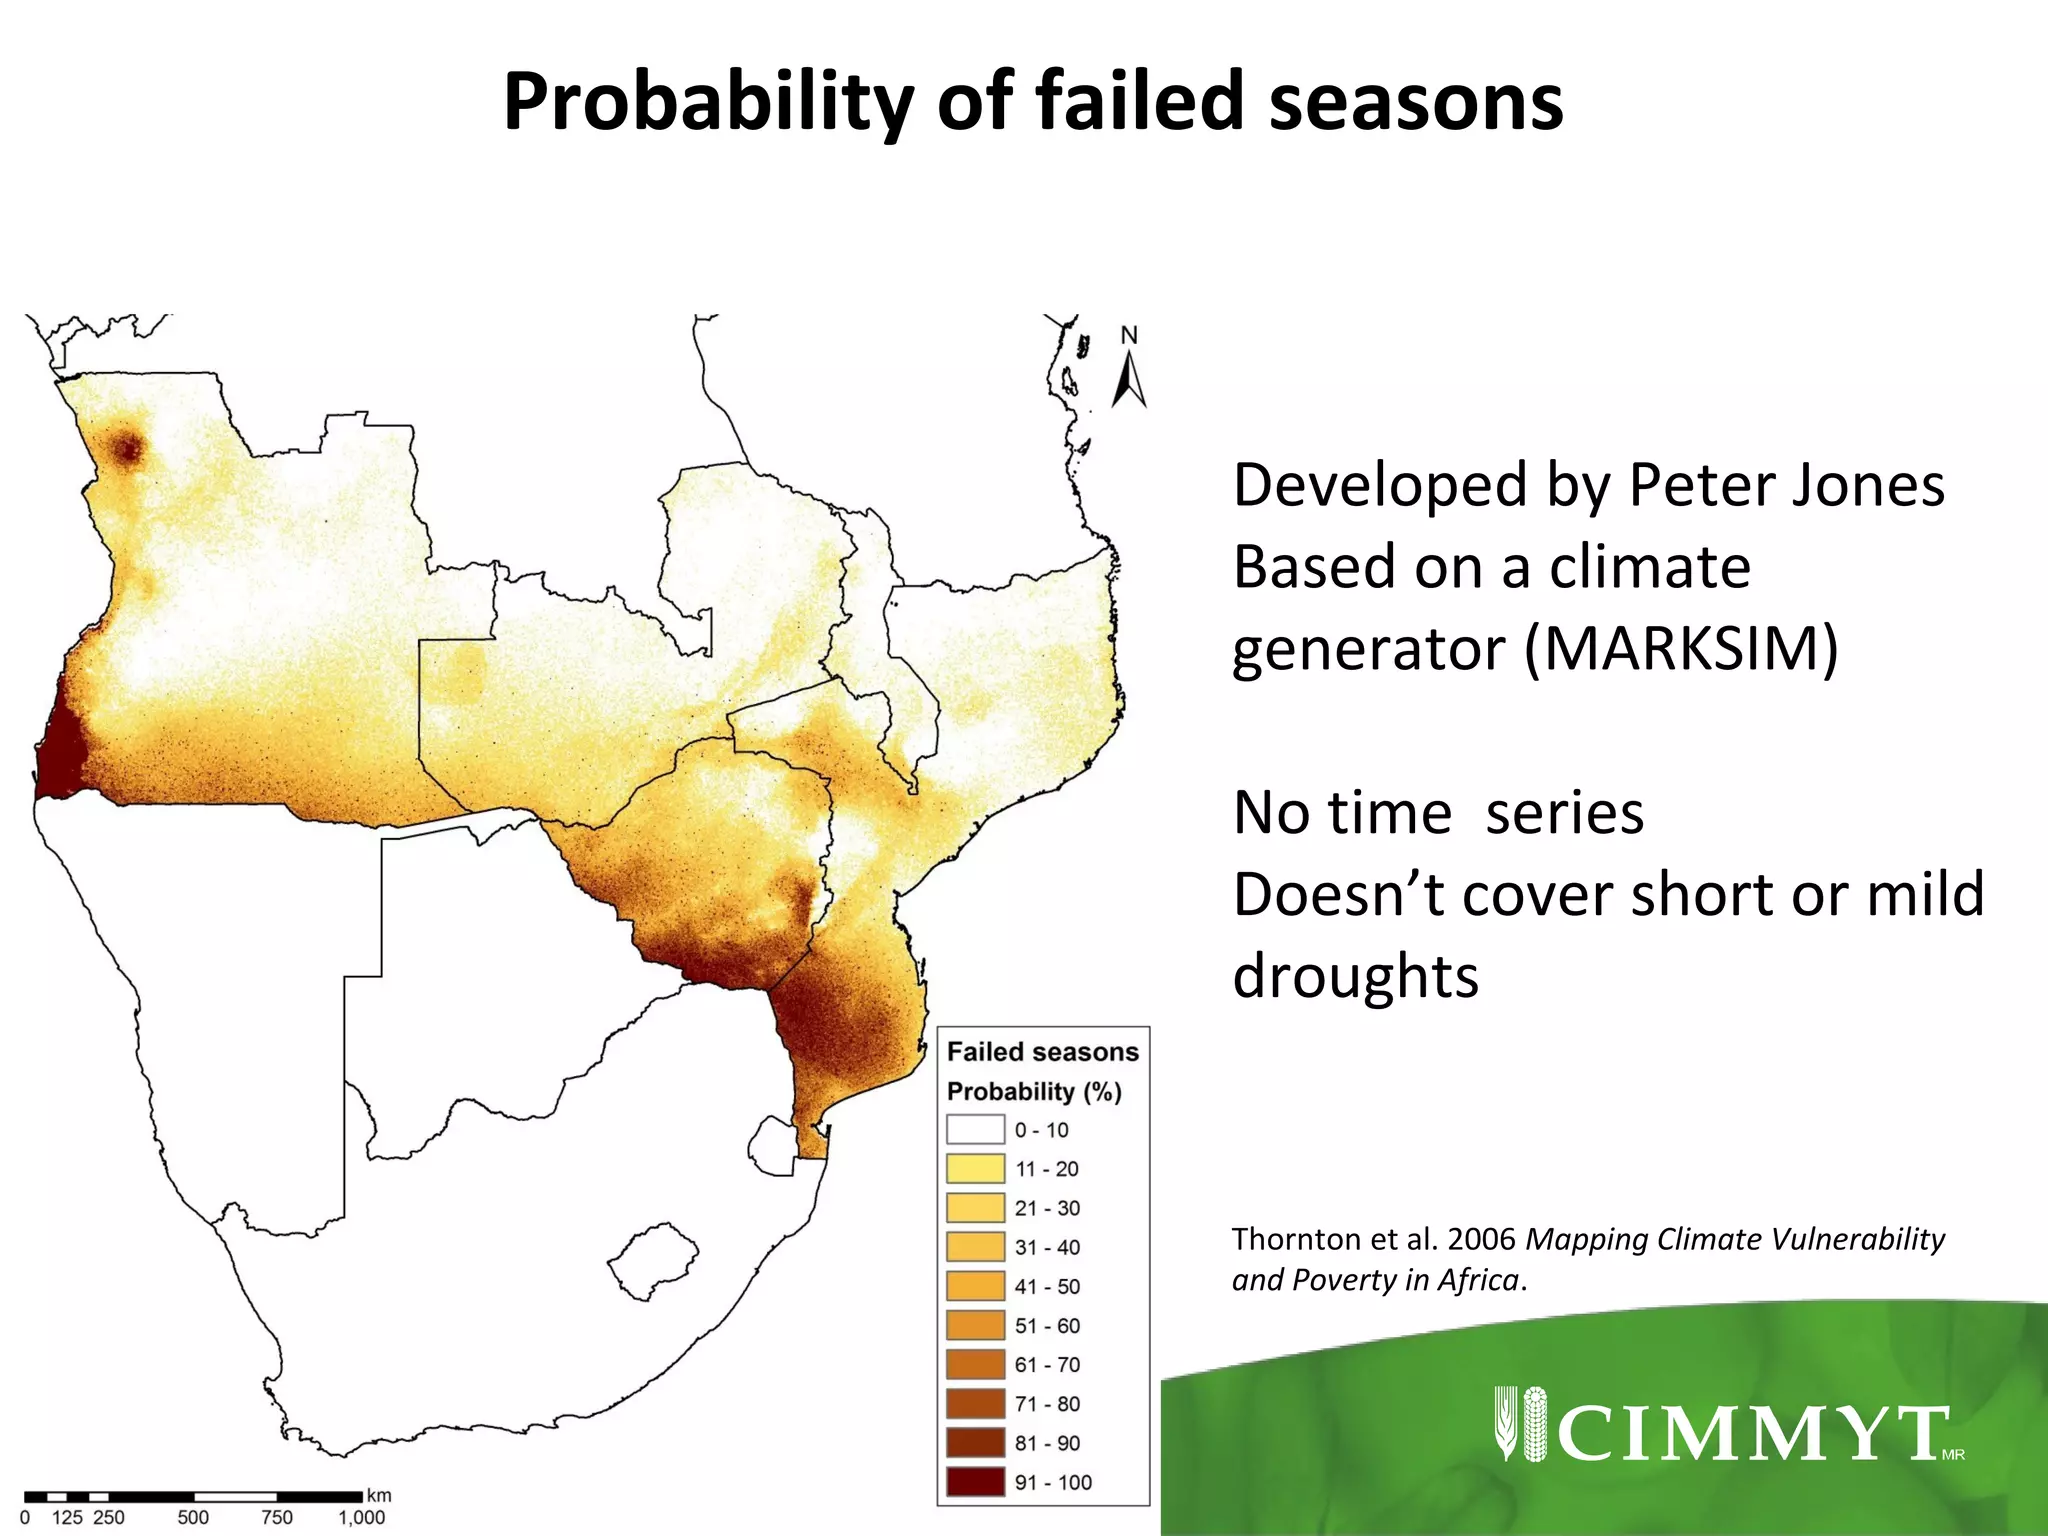
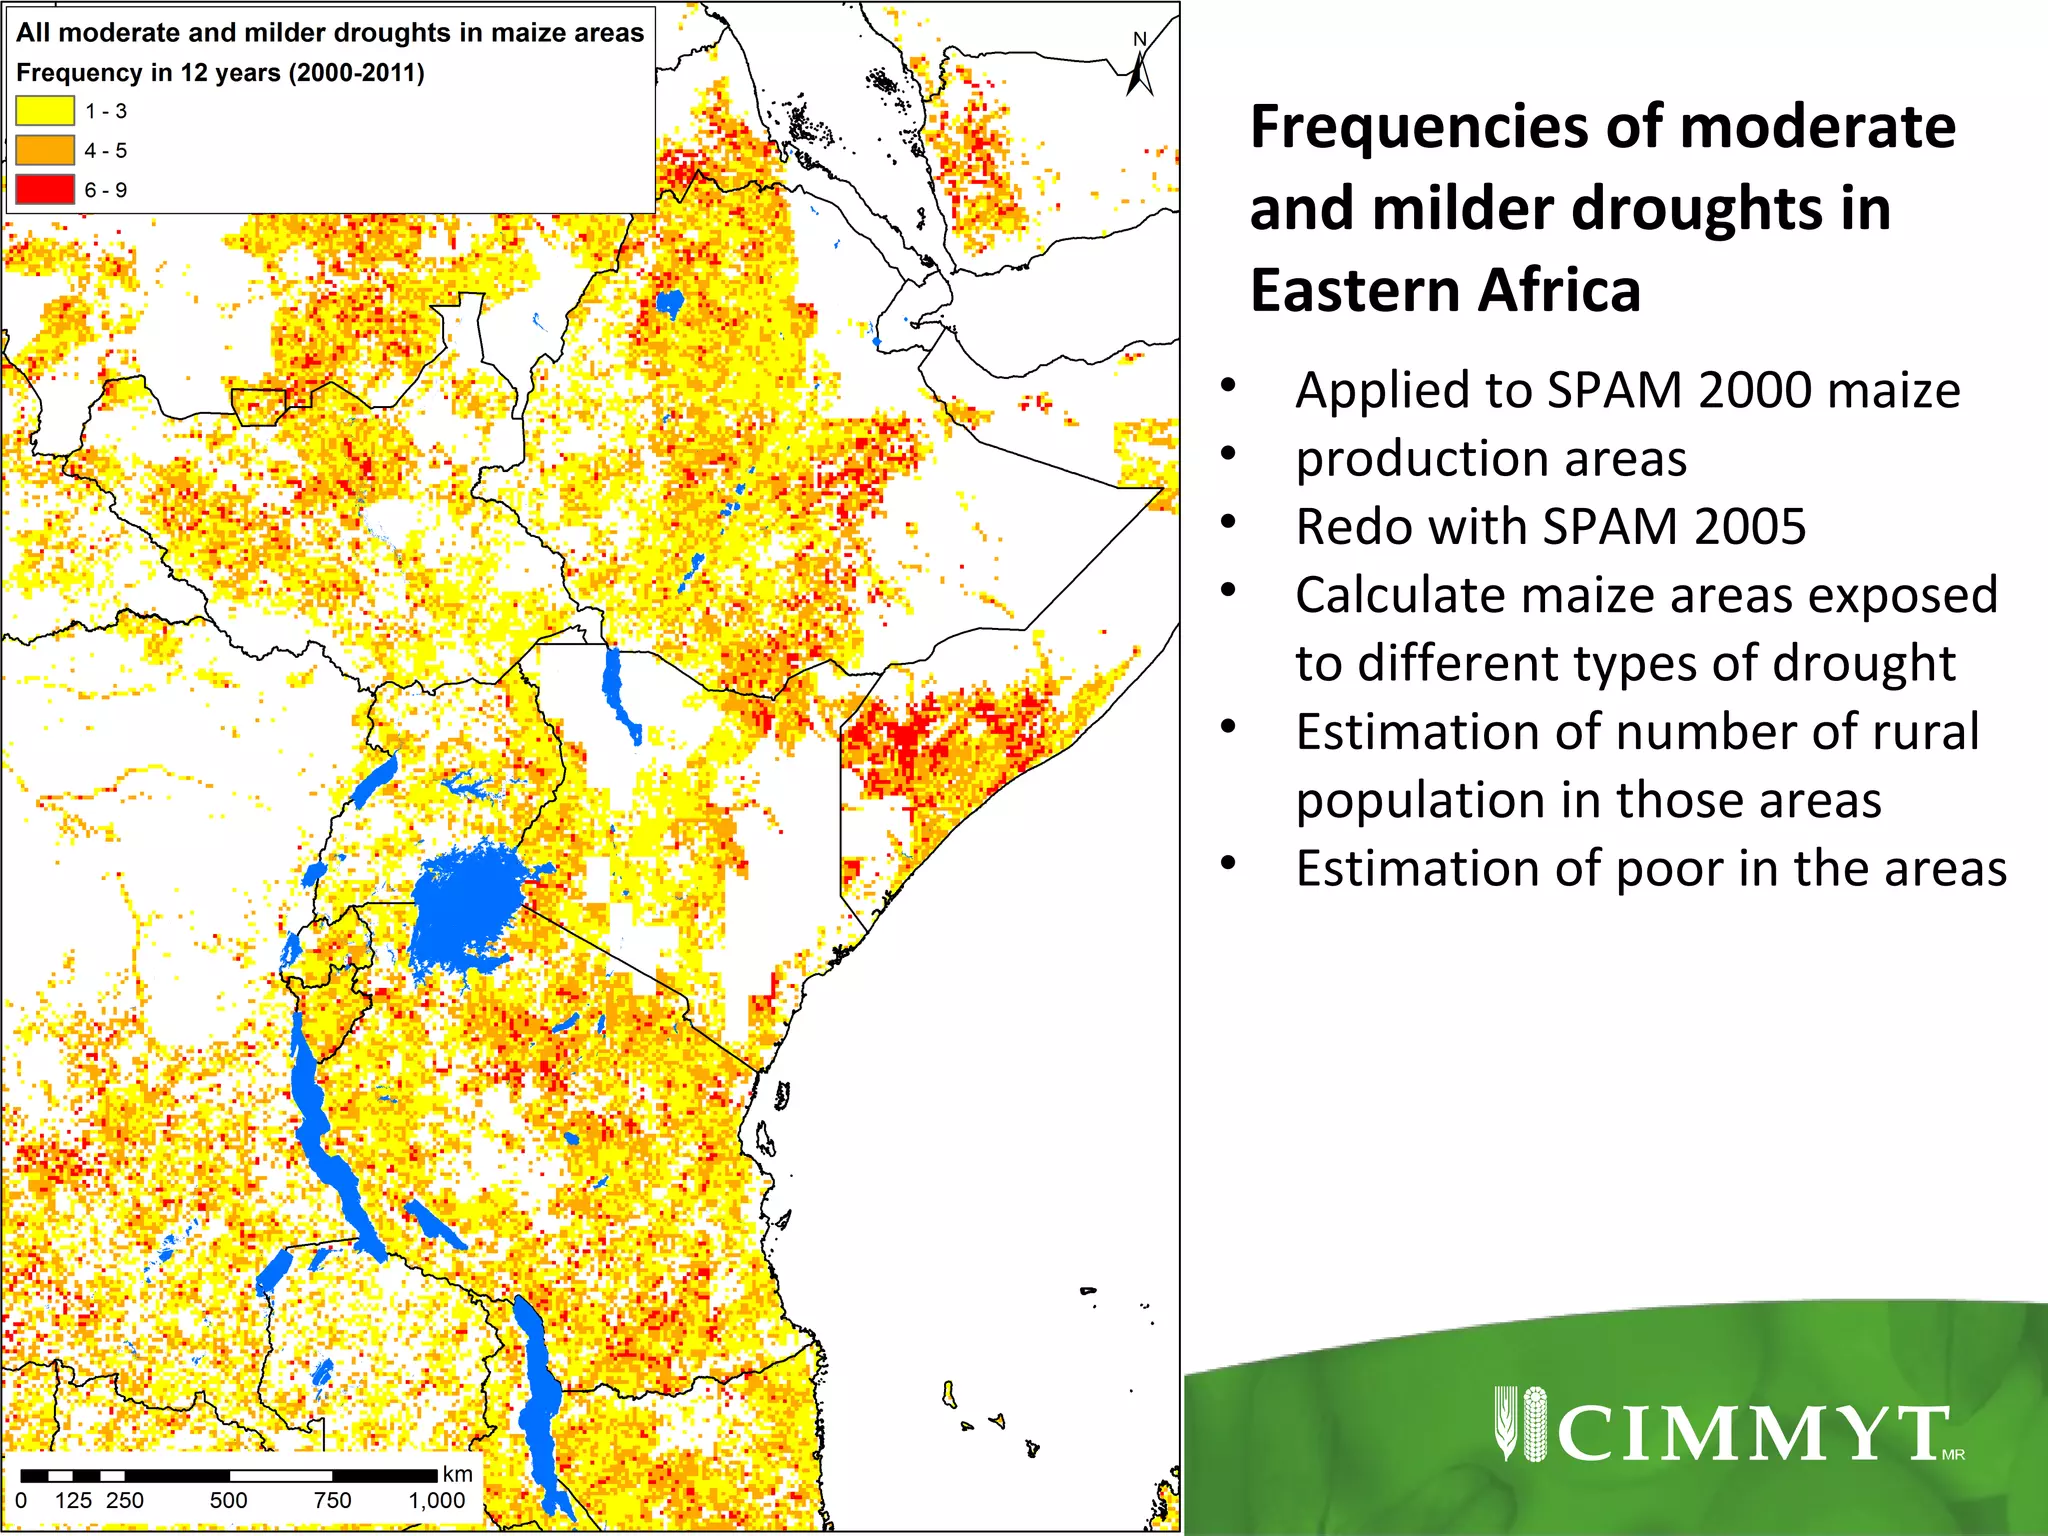
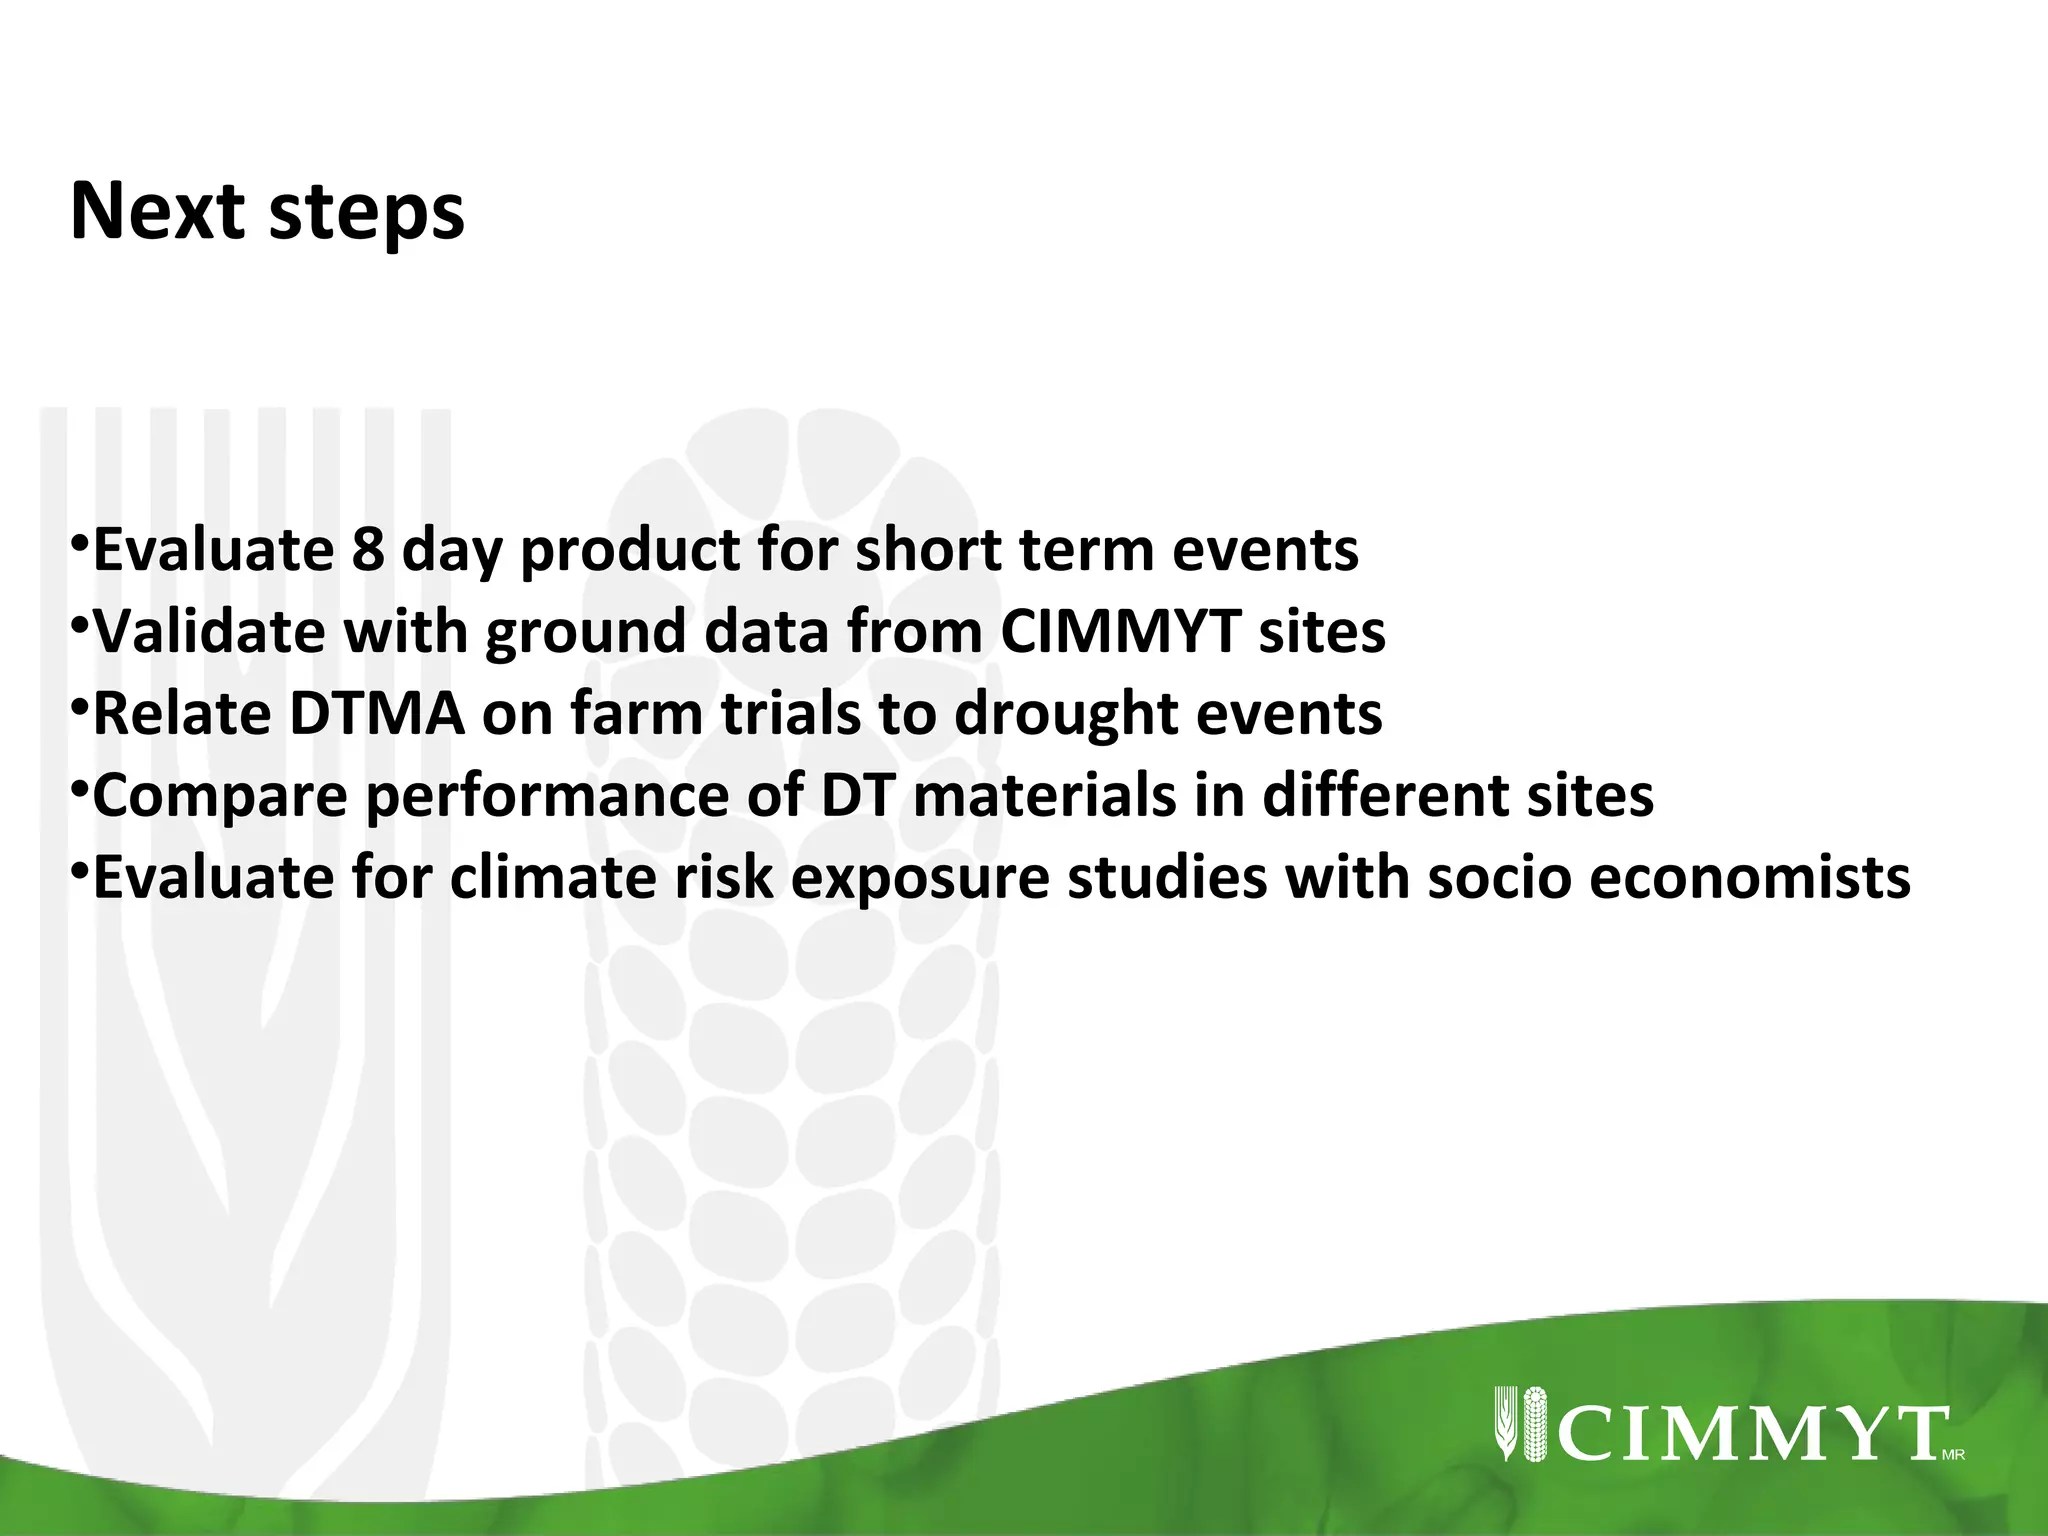
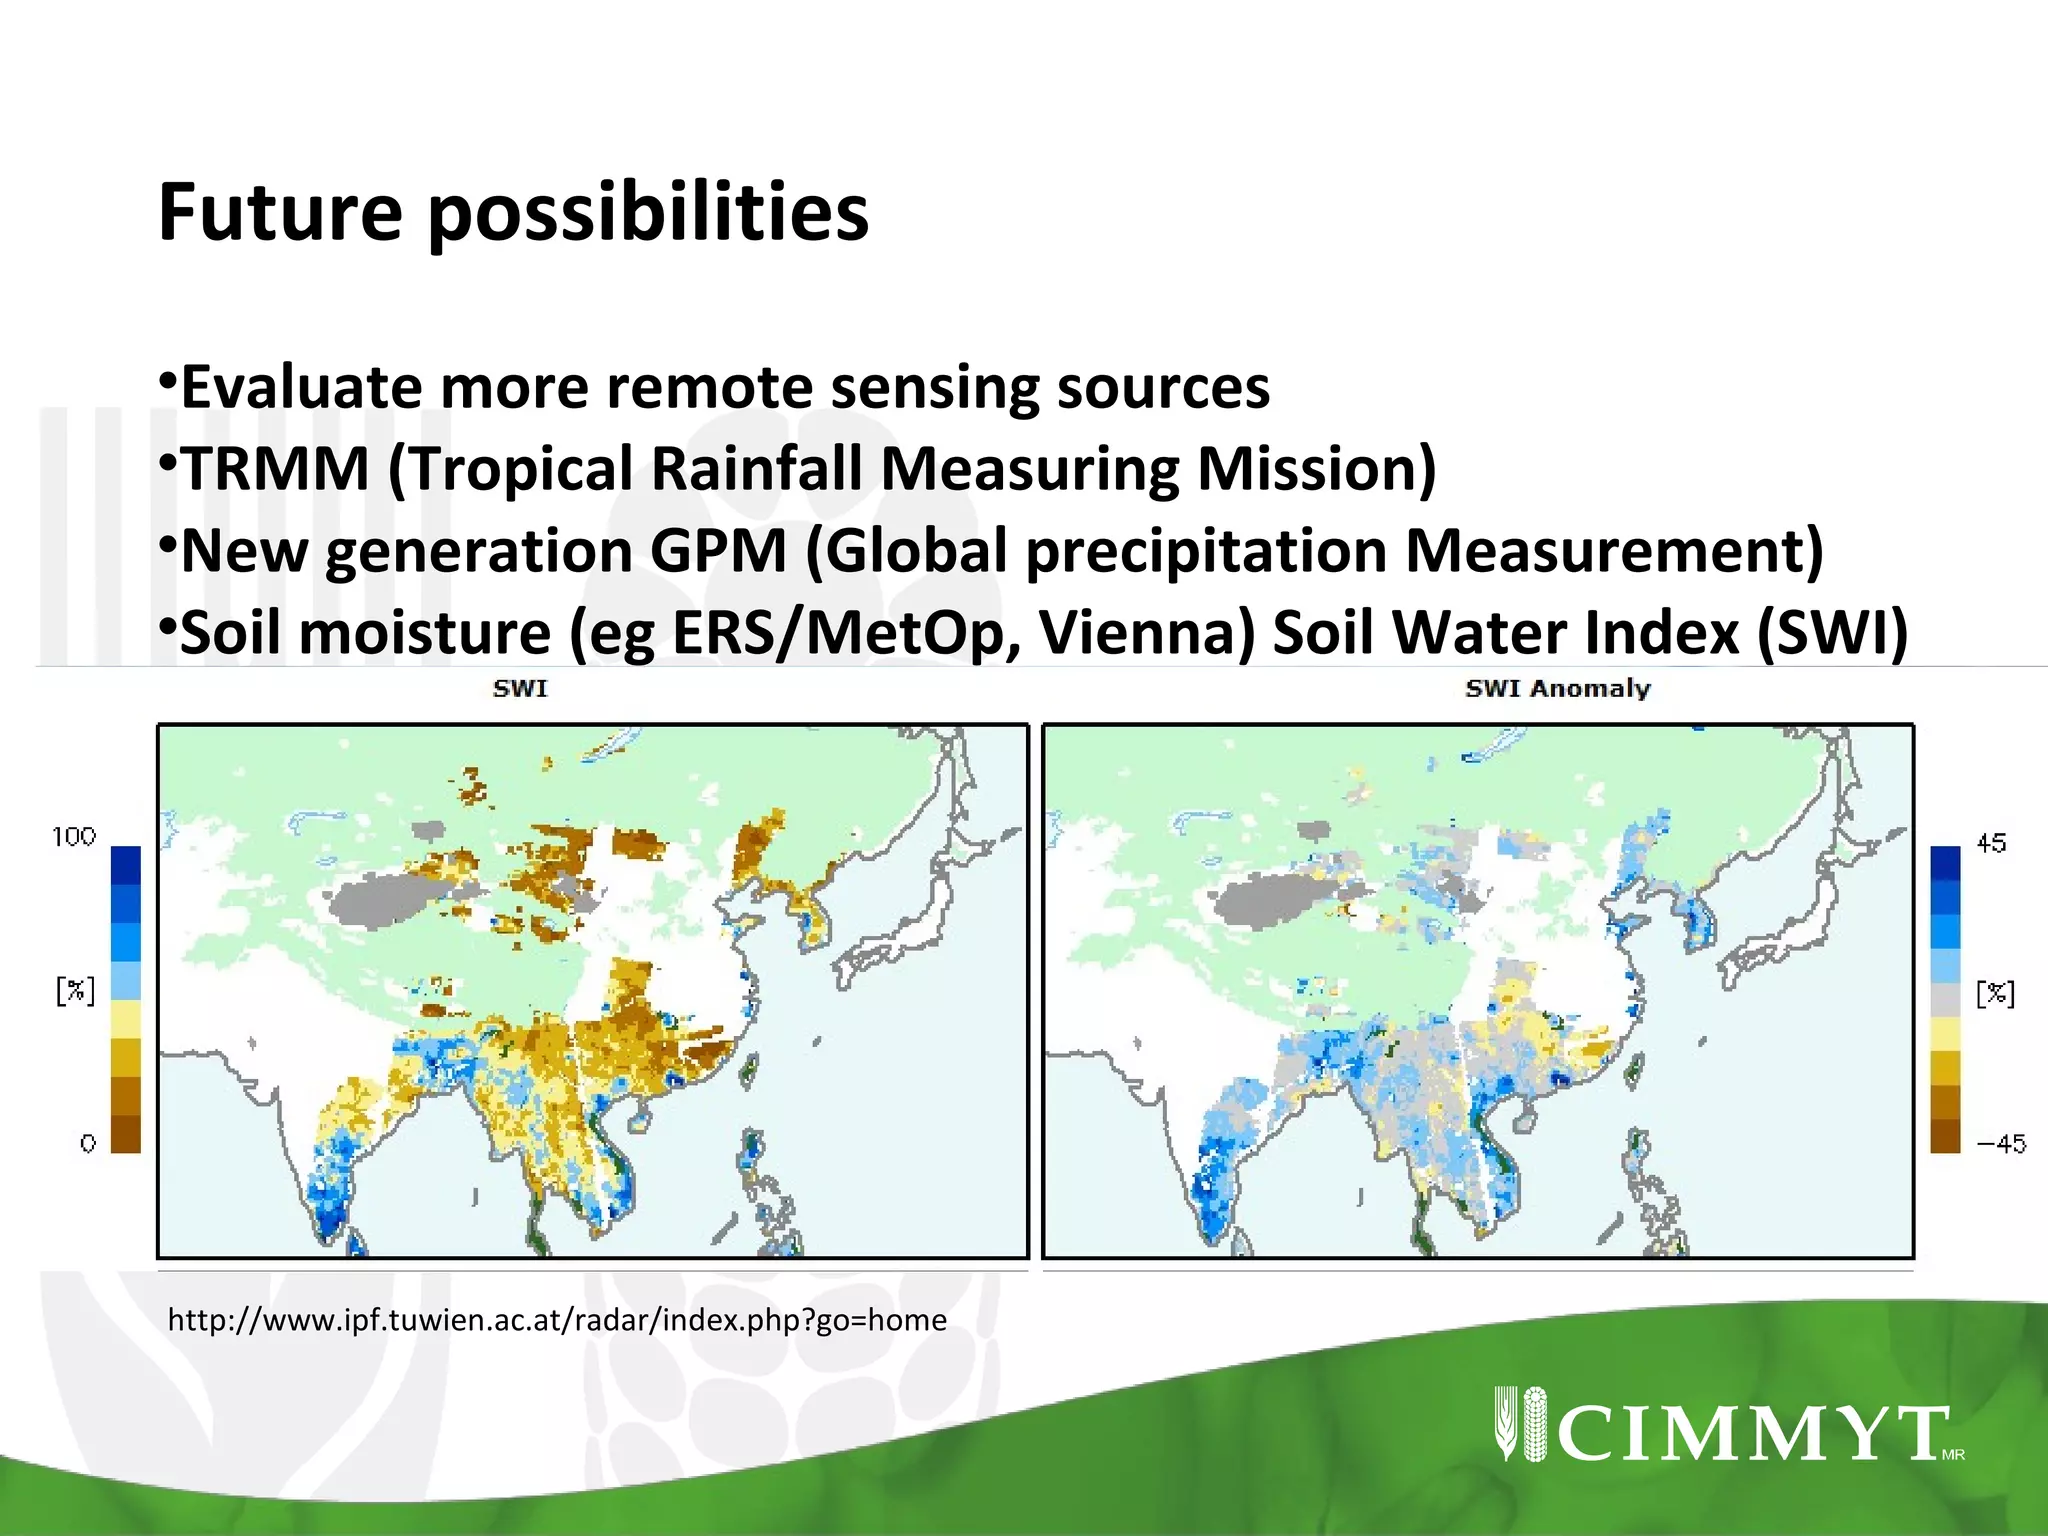
Remote sensing based drought
tolerant maize targeting in SSA

Remote sensing – Beyond Images
Kai Sonder, Jill Cairns, Olaf Erenstein, Girma Tesfahun, Kindie Tesfaye, Victor Hernandez, Dave Hodson

Mexico City, 14-15.12.2013
DTMA project: Drought tolerant maize for Africa
Mali
Nigeria
Uganda

Ghana
Benin

Angola

Zambia
Zimbabwe

Ethiopia

•
•
•
•
•
•
•

Funded by Bill & Melinda Gates Foundation
3rd phase currently
CIMMYT and IITA and many partners
13 countries in West, East and Southern Africa
Develop drought tolerant maize germplasm
Strengthen small seed companies
Make DT materials available to farmers

Kenya
Tanzania
Mozambique

Malawi
WHY do this?

•Ex ante impact assessment
•Recommendations on areas for upscaling
•Fit breeding program to areas not currently covered

HOW to target the areas where DT material would
be most useful to farmers?
•
•
•
•

Ideally use high res daily rainfall data but not really available in SSA
Failed seasons probability
Drought indices based on monthly data
Remote sensed data
Probability of failed seasons

Developed by Peter Jones
Based on a climate
generator (MARKSIM)
No time series
Doesn’t cover short or mild
droughts

Thornton et al. 2006 Mapping Climate Vulnerability
and Poverty in Africa.
Standardized Precipitation Index (SPI)

Based on rainfall only
Can be calculated at different time
scales
McKee et al., 1993

•Calculated for one month and three
month droughts for all of SSA
•Mild, Moderate, Severe, Extreme
droughts classified
•Using monthly CRU 3.1 data 19502010 (in theory 1900-2012)
•Doesn’t capture fully cover short
droughts
•WMO recommended
•Widely used
DSI (Drought Severity Index)
•Satellite image (MODIS) based (Mu et al., 2013)
•Mix of MODIS based NDVI and MODIS based ET/PET
•MOD16 ET/PET
MOD13 NDVI
•Annual and monthly and 8 day calculations possible
•Time series available currently 2000 – 2011
•Time series can be expanded
DSI Classes

Mu et al. 2013
DSI annual time series
Frequencies of moderate
and milder droughts in
Eastern Africa
•
•
•
•
•
•

Applied to SPAM 2000 maize
production areas
Redo with SPAM 2005
Calculate maize areas exposed
to different types of drought
Estimation of number of rural
population in those areas
Estimation of poor in the areas
Next steps

•Evaluate 8 day product for short term events
•Validate with ground data from CIMMYT sites
•Relate DTMA on farm trials to drought events
•Compare performance of DT materials in different sites
•Evaluate for climate risk exposure studies with socio economists
Future possibilities
•Evaluate more remote sensing sources
•TRMM (Tropical Rainfall Measuring Mission)
•New generation GPM (Global precipitation Measurement)
•Soil moisture (eg ERS/MetOp, Vienna) Soil Water Index (SWI)
•Combine with crop models

http://www.ipf.tuwien.ac.at/radar/index.php?go=home
THANK YOU
Remote sensing based drought tolerant maize targeting in SSA

Remote sensing based drought tolerant maize targeting in SSA

  • 1.
    Remote sensing baseddrought tolerant maize targeting in SSA Remote sensing – Beyond Images Kai Sonder, Jill Cairns, Olaf Erenstein, Girma Tesfahun, Kindie Tesfaye, Victor Hernandez, Dave Hodson Mexico City, 14-15.12.2013
  • 2.
    DTMA project: Droughttolerant maize for Africa Mali Nigeria Uganda Ghana Benin Angola Zambia Zimbabwe Ethiopia • • • • • • • Funded by Bill & Melinda Gates Foundation 3rd phase currently CIMMYT and IITA and many partners 13 countries in West, East and Southern Africa Develop drought tolerant maize germplasm Strengthen small seed companies Make DT materials available to farmers Kenya Tanzania Mozambique Malawi
  • 3.
    WHY do this? •Exante impact assessment •Recommendations on areas for upscaling •Fit breeding program to areas not currently covered HOW to target the areas where DT material would be most useful to farmers? • • • • Ideally use high res daily rainfall data but not really available in SSA Failed seasons probability Drought indices based on monthly data Remote sensed data
  • 4.
    Probability of failedseasons Developed by Peter Jones Based on a climate generator (MARKSIM) No time series Doesn’t cover short or mild droughts Thornton et al. 2006 Mapping Climate Vulnerability and Poverty in Africa.
  • 5.
    Standardized Precipitation Index(SPI) Based on rainfall only Can be calculated at different time scales McKee et al., 1993 •Calculated for one month and three month droughts for all of SSA •Mild, Moderate, Severe, Extreme droughts classified •Using monthly CRU 3.1 data 19502010 (in theory 1900-2012) •Doesn’t capture fully cover short droughts •WMO recommended •Widely used
  • 6.
    DSI (Drought SeverityIndex) •Satellite image (MODIS) based (Mu et al., 2013) •Mix of MODIS based NDVI and MODIS based ET/PET •MOD16 ET/PET MOD13 NDVI •Annual and monthly and 8 day calculations possible •Time series available currently 2000 – 2011 •Time series can be expanded
  • 7.
  • 8.
  • 9.
    Frequencies of moderate andmilder droughts in Eastern Africa • • • • • • Applied to SPAM 2000 maize production areas Redo with SPAM 2005 Calculate maize areas exposed to different types of drought Estimation of number of rural population in those areas Estimation of poor in the areas
  • 10.
    Next steps •Evaluate 8day product for short term events •Validate with ground data from CIMMYT sites •Relate DTMA on farm trials to drought events •Compare performance of DT materials in different sites •Evaluate for climate risk exposure studies with socio economists
  • 11.
    Future possibilities •Evaluate moreremote sensing sources •TRMM (Tropical Rainfall Measuring Mission) •New generation GPM (Global precipitation Measurement) •Soil moisture (eg ERS/MetOp, Vienna) Soil Water Index (SWI) •Combine with crop models http://www.ipf.tuwien.ac.at/radar/index.php?go=home
  • 12.

Editor's Notes

  • #2 In more than 10 years, the GIS-Lab has been working in many different Project,
  • #3 In more than 10 years, the GIS-Lab has been working in many different Project,
  • #4 In more than 10 years, the GIS-Lab has been working in many different Project,
  • #5 In more than 10 years, the GIS-Lab has been working in many different Project,
  • #6 In more than 10 years, the GIS-Lab has been working in many different Project,
  • #8 In more than 10 years, the GIS-Lab has been working in many different Project,
  • #9 In more than 10 years, the GIS-Lab has been working in many different Project,
  • #10 In more than 10 years, the GIS-Lab has been working in many different Project,
  • #11 In more than 10 years, the GIS-Lab has been working in many different Project,
  • #12 In more than 10 years, the GIS-Lab has been working in many different Project,
  • #13 In more than 10 years, the GIS-Lab has been working in many different Project,
  • #14 In more than 10 years, the GIS-Lab has been working in many different Project,