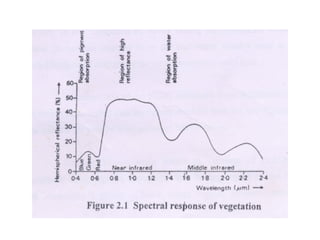
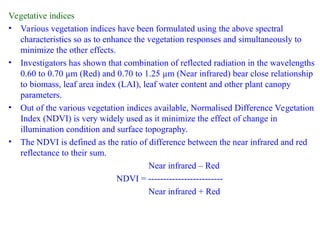
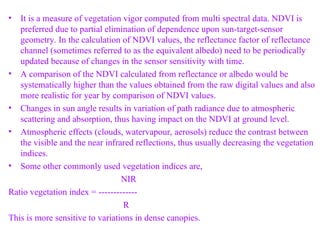
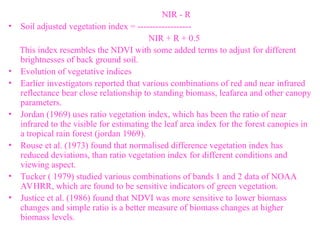
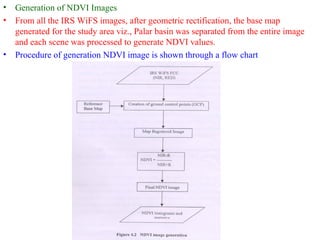
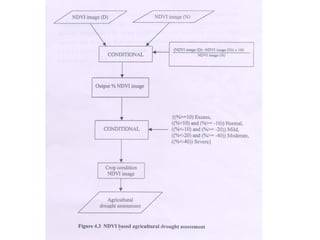
• REMOTE SENSING BASED DROUGHT ASSESSMENT
Spectral response of vegetation
• Rremote sensing based drought assessment is developed based on the difference
in spectral response characteristics for different vegetation conditions.
• The visible and near infrared bands on the satellite multi-spectral sensors allow
monitoring of the greenness or vigor of vegetation.
• Green vegetation is highly absorptive in the visible part of the spectrum, mostly
owing to the presence of chlorophyll. Beyond a wavelength of about 700
nanometers, the absence of absorbing pigments and leaf structure results in high
reflectivity for green vegetation.
• In contrast, other features such as bare ground and clouds have similar
reflectance in visible and less in near-infrared.
• Stressed vegetation is less reflective in near-infrared channel than non-stressed
vegetation and also absorbs less energy in the visible band.
• Thus the discrimination between moisture stressed and normal crops in these
wavelengths is most suitable for monitoring the impact of drought on
vegetation.
• Spectral response of vegetation is shown in figure
Vegetative indices
• Various vegetation indices have been formulated using the above spectral
characteristics so as to enhance the vegetation responses and simultaneously to
minimize the other effects.
• Investigators has shown that combination of reflected radiation in the wavelengths
0.60 to 0.70 µm (Red) and 0.70 to 1.25 µm (Near infrared) bear close relationship
to biomass, leaf area index (LAI), leaf water content and other plant canopy
parameters.
• Out of the various vegetation indices available, Normalised Difference Vegetation
Index (NDVI) is very widely used as it minimize the effect of change in
illumination condition and surface topography.
• The NDVI is defined as the ratio of difference between the near infrared and red
reflectance to their sum.
Near infrared – Red
NDVI = -------------------------
Near infrared + Red
• It is a measure of vegetation vigor computed from multi spectral data. NDVI is
preferred due to partial elimination of dependence upon sun-target-sensor
geometry. In the calculation of NDVI values, the reflectance factor of reflectance
channel (sometimes referred to as the equivalent albedo) need to be periodically
updated because of changes in the sensor sensitivity with time.
• A comparison of the NDVI calculated from reflectance or albedo would be
systematically higher than the values obtained from the raw digital values and also
more realistic for year by comparison of NDVI values.
• Changes in sun angle results in variation of path radiance due to atmospheric
scattering and absorption, thus having impact on the NDVI at ground level.
• Atmospheric effects (clouds, watervapour, aerosols) reduce the contrast between
the visible and the near infrared reflections, thus usually decreasing the vegetation
indices.
• Some other commonly used vegetation indices are,
NIR
Ratio vegetation index = -------------
R
This is more sensitive to variations in dense canopies.
NIR - R
• Soil adjusted vegetation index = ------------------
NIR + R + 0.5
This index resembles the NDVI with some added terms to adjust for different
brightnesses of back ground soil.
• Evolution of vegetative indices
• Earlier investigators reported that various combinations of red and near infrared
reflectance bear close relationship to standing biomass, leafarea and other canopy
parameters.
• Jordan (1969) uses ratio vegetation index, which has been the ratio of near
infrared to the visible for estimating the leaf area index for the forest canopies in
a tropical rain forest (jordan 1969).
• Rouse et al. (1973) found that normalised difference vegetation index has
reduced deviations, than ratio vegetation index for different conditions and
viewing aspect.
• Tucker ( 1979) studied various combinations of bands 1 and 2 data of NOAA
AVHRR, which are found to be sensitive indicators of green vegetation.
• Justice et al. (1986) found that NDVI was more sensitive to lower biomass
changes and simple ratio is a better measure of biomass changes at higher
biomass levels.
• DROUGHT ASSESSMENT METHODOLOGY
• IRS WiFS images for Samba and Navarai seasons of the years 1998 &
1999, purchased from NDC, National Remote Sensing Agency, Hyderabad.
Basic geometric and radiometric correction is not oriented towards true north
position. Hence geometric rectification of satellite data with digital map base is
necessary.
• Geometric rectification of satellite data is essential for transferring
ancillary information and crop training sites on to satellite data. It also enables to
enumerate crop statistics at various levels and to study the temporal changes in the
command area.
• Satellite data was tied to digital map base by giving sufficient Ground
Control Points (GCP) such as linear features (road, rail, river) intersections and other
stable topographic features on both the raw satellite data and the digital map base.
• These GCPs were fitted in second and third order polynomial equations by reducing
the root mean square (RMS) error. Then the satellite data was rectified to digital map
base using this equation.
• Similarly other satellite data sets were rectified with reference to already corrected
satellite data bringing all the satellite data to the common projection with that of the
digital map base.
• This enables the features on the map base prepared as discussed aoove to be
overlaid and counter checked on satellite data.
• Generation of NDVI Images
• From all the IRS WiFS images, after geometric rectification, the base map
generated for the study area viz., Palar basin was separated from the entire image
and each scene was processed to generate NDVI values.
• Procedure of generation NDVI image is shown through a flow chart
• Crop area estimation
• An attempt was made for estimation of crop area under major crops in the study
area. It is easy to differentiate vegetation area from satellite data by considering
positive NDVI values.
• From the total vegetation area using different GIS layers for forest area, barren
lands are eliminated, so that area under major crops is obtained. Based on crop
calendar and the NDVI response during the period, crop areas are estimated.
• Procedure adopted for the estimation of crop area is as follows.
• The vectors layers of forest and barren land areas taken from the digitized land use
map of Palar basin were cleaned and built and rasterized by giving same pixel value
in all the polygons.
• Thus a separate forest and barren land mask was generated. From all the scenes this
mask is subsequently used for excluding the forest and barren land areas, which are
not used for agricultural purposes.
• The total crop area mask under agricultural vegetation has been prepared for the
NDVI images of Nov 1988, Nov 1999, Mar 1998 and Mar 1999 by eliminating the
area under the forest and barren land.
• Paddy is the single major crop in the study area. An attempt has been made to
estimate the aerial extent under paddy crop in each block of the basin.
• Adopting the National Agricultural Drought Assessment and Monitoring System
rules, all the NDVI values falling between 0.35 and 0.80 were grouped to obtain the
spatial extent of paddy area in the basin and NDVI statistics were extracted from the
paddy range to check the paddy crop area in each block.
• Agricultural Drought Assessment
• Crop condition at any given time during its growth is influenced by complex
interactions of weather, soil moisture, soil and crop type. It has been universally
accepted that satellite derived NDVI can be used as an index to assess crop
stage/condition.
• Crop condition assessment in the study area is made by comparing the NDVI values
in the year 1999 ( deficit year) with 1998 (normal year).
• The flow chart shown explains the procedure adopted in agricultural drought
assessment
• In the first stage, from the 1999 and 1998 NDVI images, % NDVI image for 1999 wa
obtained by applying the condition (99NDVI image -98NDVI image)*100/(98 NDVI
image).
• From this crop condition NDVI image was generated by adopting 5 classess as
NDVI >+ 10%: Excess,
-19 to +10%: Normal,
-10 to -20%: Mild,
-20 to -40%: Moderate and
< -40% Severe.
• Crop condition NDVI image was reclassified to obtain the agricultural drought
assessment. Weightages 1 for excess, 2 for normal, 3 for mild drought, 4 for moderate
drought and 5 for severe drought were given in order to arrive a single value for each
block.
• On these values, reclassification was made as
1 to 1.5; excess,
1.5 to 2.5; normal,
2.5 to 3.5 mild drought,
3.5 to 4.5; moderate drought and
4.5 to 5 severe drought.

Normalized Difference Vegetation Indices

  • 1.
    • REMOTE SENSINGBASED DROUGHT ASSESSMENT Spectral response of vegetation • Rremote sensing based drought assessment is developed based on the difference in spectral response characteristics for different vegetation conditions. • The visible and near infrared bands on the satellite multi-spectral sensors allow monitoring of the greenness or vigor of vegetation. • Green vegetation is highly absorptive in the visible part of the spectrum, mostly owing to the presence of chlorophyll. Beyond a wavelength of about 700 nanometers, the absence of absorbing pigments and leaf structure results in high reflectivity for green vegetation. • In contrast, other features such as bare ground and clouds have similar reflectance in visible and less in near-infrared. • Stressed vegetation is less reflective in near-infrared channel than non-stressed vegetation and also absorbs less energy in the visible band. • Thus the discrimination between moisture stressed and normal crops in these wavelengths is most suitable for monitoring the impact of drought on vegetation. • Spectral response of vegetation is shown in figure
  • 3.
    Vegetative indices • Variousvegetation indices have been formulated using the above spectral characteristics so as to enhance the vegetation responses and simultaneously to minimize the other effects. • Investigators has shown that combination of reflected radiation in the wavelengths 0.60 to 0.70 µm (Red) and 0.70 to 1.25 µm (Near infrared) bear close relationship to biomass, leaf area index (LAI), leaf water content and other plant canopy parameters. • Out of the various vegetation indices available, Normalised Difference Vegetation Index (NDVI) is very widely used as it minimize the effect of change in illumination condition and surface topography. • The NDVI is defined as the ratio of difference between the near infrared and red reflectance to their sum. Near infrared – Red NDVI = ------------------------- Near infrared + Red
  • 4.
    • It isa measure of vegetation vigor computed from multi spectral data. NDVI is preferred due to partial elimination of dependence upon sun-target-sensor geometry. In the calculation of NDVI values, the reflectance factor of reflectance channel (sometimes referred to as the equivalent albedo) need to be periodically updated because of changes in the sensor sensitivity with time. • A comparison of the NDVI calculated from reflectance or albedo would be systematically higher than the values obtained from the raw digital values and also more realistic for year by comparison of NDVI values. • Changes in sun angle results in variation of path radiance due to atmospheric scattering and absorption, thus having impact on the NDVI at ground level. • Atmospheric effects (clouds, watervapour, aerosols) reduce the contrast between the visible and the near infrared reflections, thus usually decreasing the vegetation indices. • Some other commonly used vegetation indices are, NIR Ratio vegetation index = ------------- R This is more sensitive to variations in dense canopies.
  • 5.
    NIR - R •Soil adjusted vegetation index = ------------------ NIR + R + 0.5 This index resembles the NDVI with some added terms to adjust for different brightnesses of back ground soil. • Evolution of vegetative indices • Earlier investigators reported that various combinations of red and near infrared reflectance bear close relationship to standing biomass, leafarea and other canopy parameters. • Jordan (1969) uses ratio vegetation index, which has been the ratio of near infrared to the visible for estimating the leaf area index for the forest canopies in a tropical rain forest (jordan 1969). • Rouse et al. (1973) found that normalised difference vegetation index has reduced deviations, than ratio vegetation index for different conditions and viewing aspect. • Tucker ( 1979) studied various combinations of bands 1 and 2 data of NOAA AVHRR, which are found to be sensitive indicators of green vegetation. • Justice et al. (1986) found that NDVI was more sensitive to lower biomass changes and simple ratio is a better measure of biomass changes at higher biomass levels.
  • 6.
    • DROUGHT ASSESSMENTMETHODOLOGY • IRS WiFS images for Samba and Navarai seasons of the years 1998 & 1999, purchased from NDC, National Remote Sensing Agency, Hyderabad. Basic geometric and radiometric correction is not oriented towards true north position. Hence geometric rectification of satellite data with digital map base is necessary. • Geometric rectification of satellite data is essential for transferring ancillary information and crop training sites on to satellite data. It also enables to enumerate crop statistics at various levels and to study the temporal changes in the command area. • Satellite data was tied to digital map base by giving sufficient Ground Control Points (GCP) such as linear features (road, rail, river) intersections and other stable topographic features on both the raw satellite data and the digital map base. • These GCPs were fitted in second and third order polynomial equations by reducing the root mean square (RMS) error. Then the satellite data was rectified to digital map base using this equation. • Similarly other satellite data sets were rectified with reference to already corrected satellite data bringing all the satellite data to the common projection with that of the digital map base. • This enables the features on the map base prepared as discussed aoove to be overlaid and counter checked on satellite data.
  • 7.
    • Generation ofNDVI Images • From all the IRS WiFS images, after geometric rectification, the base map generated for the study area viz., Palar basin was separated from the entire image and each scene was processed to generate NDVI values. • Procedure of generation NDVI image is shown through a flow chart
  • 8.
    • Crop areaestimation • An attempt was made for estimation of crop area under major crops in the study area. It is easy to differentiate vegetation area from satellite data by considering positive NDVI values. • From the total vegetation area using different GIS layers for forest area, barren lands are eliminated, so that area under major crops is obtained. Based on crop calendar and the NDVI response during the period, crop areas are estimated. • Procedure adopted for the estimation of crop area is as follows. • The vectors layers of forest and barren land areas taken from the digitized land use map of Palar basin were cleaned and built and rasterized by giving same pixel value in all the polygons. • Thus a separate forest and barren land mask was generated. From all the scenes this mask is subsequently used for excluding the forest and barren land areas, which are not used for agricultural purposes. • The total crop area mask under agricultural vegetation has been prepared for the NDVI images of Nov 1988, Nov 1999, Mar 1998 and Mar 1999 by eliminating the area under the forest and barren land.
  • 9.
    • Paddy isthe single major crop in the study area. An attempt has been made to estimate the aerial extent under paddy crop in each block of the basin. • Adopting the National Agricultural Drought Assessment and Monitoring System rules, all the NDVI values falling between 0.35 and 0.80 were grouped to obtain the spatial extent of paddy area in the basin and NDVI statistics were extracted from the paddy range to check the paddy crop area in each block. • Agricultural Drought Assessment • Crop condition at any given time during its growth is influenced by complex interactions of weather, soil moisture, soil and crop type. It has been universally accepted that satellite derived NDVI can be used as an index to assess crop stage/condition. • Crop condition assessment in the study area is made by comparing the NDVI values in the year 1999 ( deficit year) with 1998 (normal year). • The flow chart shown explains the procedure adopted in agricultural drought assessment
  • 11.
    • In thefirst stage, from the 1999 and 1998 NDVI images, % NDVI image for 1999 wa obtained by applying the condition (99NDVI image -98NDVI image)*100/(98 NDVI image). • From this crop condition NDVI image was generated by adopting 5 classess as NDVI >+ 10%: Excess, -19 to +10%: Normal, -10 to -20%: Mild, -20 to -40%: Moderate and < -40% Severe. • Crop condition NDVI image was reclassified to obtain the agricultural drought assessment. Weightages 1 for excess, 2 for normal, 3 for mild drought, 4 for moderate drought and 5 for severe drought were given in order to arrive a single value for each block. • On these values, reclassification was made as 1 to 1.5; excess, 1.5 to 2.5; normal, 2.5 to 3.5 mild drought, 3.5 to 4.5; moderate drought and 4.5 to 5 severe drought.