More Related Content
Similar to Forney TX - July 2010 Market Report
Similar to Forney TX - July 2010 Market Report (17)
More from Valarie Littles
More from Valarie Littles (20)
Forney TX - July 2010 Market Report
- 1. Valarie Littles Median For Sale vs. Median Sold Ultima Real Estate
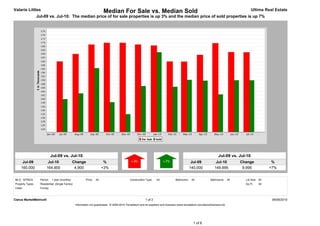
Jul-09 vs. Jul-10: The median price of for sale properties is up 3% and the median price of sold properties is up 7%
Jul-09 vs. Jul-10 Jul-09 vs. Jul-10
Jul-09 Jul-10 Change % Jul-09 Jul-10 Change %
160,000 164,900 4,900 +3% 140,000 149,995 9,995 +7%
MLS: NTREIS Period: 1 year (monthly) Price: All Construction Type: All Bedrooms: All Bathrooms: All Lot Size: All
Property Types: Residential: (Single Family) Sq Ft: All
Cities: Forney
Clarus MarketMetrics® 1 of 2 08/08/2010
Information not guaranteed. © 2009-2010 Terradatum and its suppliers and licensors (www.terradatum.com/about/licensors.td).
1 of 6
- 2. Valarie Littles Median For Sale vs. Median Sold Ultima Real Estate
Jul-09 vs. Jul-10: The median price of for sale properties is up 3% and the median price of sold properties is up 7%
For Sale # Properties Sold # Properties Price
Time Period Median For Sale Median Sold Difference
Jul-10 164,900 357 149,995 30 -14,905
Jun-10 165,000 367 150,000 56 -15,000
May-10 169,707 327 142,500 45 -27,207
Apr-10 163,479.5 358 149,800 46 -13,679
Mar-10 159,933.5 328 150,233.5 40 -9,700
Feb-10 160,000 285 146,500 32 -13,500
Jan-10 168,500 282 164,905 39 -3,595
Dec-09 169,000 273 146,900 43 -22,100
Nov-09 169,900 265 132,000 33 -37,900
Oct-09 169,900 277 138,375 40 -31,525
Sep-09 169,000 282 156,450 38 -12,550
Aug-09 163,950 300 143,045 52 -20,905
Jul-09 160,000 305 140,000 53 -20,000
Clarus MarketMetrics® 2 of 2 08/08/2010
Information not guaranteed. © 2009-2010 Terradatum and its suppliers and licensors (www.terradatum.com/about/licensors.td).
2 of 6
- 3. Valarie Littles Supply & Demand by Month Ultima Real Estate
Jul-09 vs. Jul-10: The number of for sale properties is up 17% and the number of sold properties is down 43%
Jul-09 vs. Jul-10 Jul-09 vs. Jul-10
Jul-09 Jul-10 Change % Jul-09 Jul-10 Change %
305 357 52 +17% 53 30 -23 -43%
MLS: NTREIS Period: 1 year (monthly) Price: All Construction Type: All Bedrooms: All Bathrooms: All Lot Size: All
Property Types: Residential: (Single Family) Sq Ft: All
Cities: Forney
Clarus MarketMetrics® 1 of 2 08/08/2010
Information not guaranteed. © 2009-2010 Terradatum and its suppliers and licensors (www.terradatum.com/about/licensors.td).
3 of 6
- 4. Valarie Littles Supply & Demand by Month Ultima Real Estate
Jul-09 vs. Jul-10: The number of for sale properties is up 17% and the number of sold properties is down 43%
# Properties Average DOM # Properties Average DOM
Time Period For Sale For Sale Sold Sold
Jul-10 357 109 30 88
Jun-10 367 123 56 77
May-10 327 144 45 73
Apr-10 358 145 46 98
Mar-10 328 158 40 71
Feb-10 285 170 32 81
Jan-10 282 174 39 79
Dec-09 273 180 43 65
Nov-09 265 185 33 69
Oct-09 277 184 40 93
Sep-09 282 190 38 64
Aug-09 300 182 52 79
Jul-09 305 181 53 83
Clarus MarketMetrics® 2 of 2 08/08/2010
Information not guaranteed. © 2009-2010 Terradatum and its suppliers and licensors (www.terradatum.com/about/licensors.td).
4 of 6
- 5. Valarie Littles Months Supply of Inventory Ultima Real Estate
Jul-09 vs. Jul-10: The average months supply of inventory is up 39%
Jul-09 vs. Jul-10
Jul-09 Jul-10 Change %
5.5 7.7 2.2 +39%
MLS: NTREIS Period: 1 year (monthly) Price: All Construction Type: All Bedrooms: All Bathrooms: All Lot Size: All
Property Types: Residential: (Single Family) Sq Ft: All
Cities: Forney
Clarus MarketMetrics® 1 of 2 08/08/2010
Information not guaranteed. © 2009-2010 Terradatum and its suppliers and licensors (www.terradatum.com/about/licensors.td).
5 of 6
- 6. Valarie Littles Months Supply of Inventory Ultima Real Estate
Jul-09 vs. Jul-10: The average months supply of inventory is up 39%
# Units For Sale # UC Units UC Average
Time Period Last Day of Month During Month MSI DOM
Jul-10 293 38 8 114
Jun-10 296 48 6 82
May-10 269 35 8 84
Apr-10 268 67 4 73
Mar-10 260 46 6 84
Feb-10 242 28 9 74
Jan-10 197 51 4 73
Dec-09 212 32 7 67
Nov-09 213 36 6 80
Oct-09 204 47 4 85
Sep-09 215 42 5 94
Aug-09 228 40 6 60
Jul-09 238 43 6 74
Clarus MarketMetrics® 2 of 2 08/08/2010
Information not guaranteed. © 2009-2010 Terradatum and its suppliers and licensors (www.terradatum.com/about/licensors.td).
6 of 6