More Related Content
Similar to Allen Market Report - March 2010
Similar to Allen Market Report - March 2010 (15)
More from Valarie Littles
More from Valarie Littles (20)
Allen Market Report - March 2010
- 1. Valarie Littles Median For Sale vs. Median Sold Ultima Real Estate
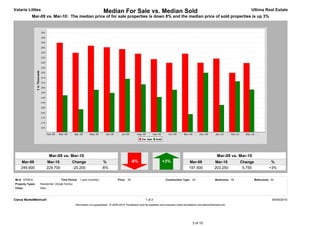
Mar-09 vs. Mar-10: The median price of for sale properties is down 8% and the median price of sold properties is up 3%
Mar-09 vs. Mar-10 Mar-09 vs. Mar-10
Mar-09 Mar-10 Change % -8% +3% Mar-09 Mar-10 Change %
249,900 229,700 -20,200 -8% 197,500 203,250 5,750 +3%
MLS: NTREIS Time Period: 1 year (monthly) Price: All Construction Type: All Bedrooms: All Bathrooms: All
Property Types: Residential: (Single Family)
Cities: Allen
Clarus MarketMetrics® 1 of 2 04/05/2010
Information not guaranteed. © 2009-2010 Terradatum and its suppliers and licensors (www.terradatum.com/about/licensors.td).
3 of 10
- 2. Valarie Littles Median For Sale vs. Median Sold Ultima Real Estate
Mar-09 vs. Mar-10: The median price of for sale properties is down 8% and the median price of sold properties is up 3%
# Units For Sale Sold
Time Period For Sale Average DOM # Sold Units Average DOM
Mar-10 638 79 104 60
Feb-10 549 105 74 76
Jan-10 502 125 57 65
Dec-09 490 139 64 68
Nov-09 488 146 82 55
Oct-09 520 142 130 71
Sep-09 536 141 127 69
Aug-09 609 139 118 78
Jul-09 646 139 132 64
Jun-09 636 144 163 59
May-09 651 143 99 66
Apr-09 677 142 114 81
Mar-09 679 145 105 89
Clarus MarketMetrics® 2 of 2 04/05/2010
Information not guaranteed. © 2009-2010 Terradatum and its suppliers and licensors (www.terradatum.com/about/licensors.td).
4 of 10
- 3. Valarie Littles Supply & Demand by Month Ultima Real Estate
Mar-09 vs. Mar-10: The number of for sale properties is down 6% and the number of sold properties is down 1%
Mar-09 vs. Mar-10 Mar-09 vs. Mar-10
Mar-09 Mar-10 Change % -6% -1% Mar-09 Mar-10 Change %
679 638 -41 -6% 105 104 -1 -1%
MLS: NTREIS Time Period: 1 year (monthly) Price: All Construction Type: All Bedrooms: All Bathrooms: All
Property Types: Residential: (Single Family)
Cities: Allen
Clarus MarketMetrics® 1 of 2 04/05/2010
Information not guaranteed. © 2009-2010 Terradatum and its suppliers and licensors (www.terradatum.com/about/licensors.td).
7 of 10
- 4. Valarie Littles Supply & Demand by Month Ultima Real Estate
Mar-09 vs. Mar-10: The number of for sale properties is down 6% and the number of sold properties is down 1%
# Units For Sale Sold
Time Period For Sale Average DOM # Sold Units Average DOM
Mar-10 638 79 104 60
Feb-10 549 105 74 76
Jan-10 502 125 57 65
Dec-09 490 139 64 68
Nov-09 488 146 82 55
Oct-09 520 142 130 71
Sep-09 536 141 127 69
Aug-09 609 139 118 78
Jul-09 646 139 132 64
Jun-09 636 144 163 59
May-09 651 143 99 66
Apr-09 677 142 114 81
Mar-09 679 145 105 89
Clarus MarketMetrics® 2 of 2 04/05/2010
Information not guaranteed. © 2009-2010 Terradatum and its suppliers and licensors (www.terradatum.com/about/licensors.td).
8 of 10