More Related Content
Similar to Forney TX - Housing Market Report - August 2010
Similar to Forney TX - Housing Market Report - August 2010 (19)
More from Valarie Littles
More from Valarie Littles (20)
Forney TX - Housing Market Report - August 2010
- 1. Valarie Littles Ultima Real Estate
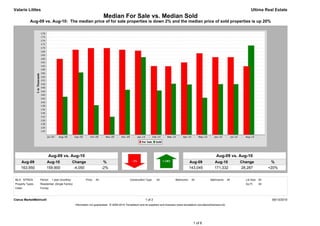
Median For Sale vs. Median Sold
Aug-09 vs. Aug-10: The median price of for sale properties is down 2% and the median price of sold properties is up 20%
Aug-09 vs. Aug-10 Aug-09 vs. Aug-10
Aug-09 Aug-10 Change % Aug-09 Aug-10 Change %
163,950 159,900 -4,050 -2% 143,045 171,332 28,287 +20%
MLS: NTREIS Period: 1 year (monthly) Price: All Construction Type: All Bedrooms: All Bathrooms: All Lot Size: All
Property Types: Residential: (Single Family) Sq Ft: All
Cities: Forney
Clarus MarketMetrics® 1 of 2 09/13/2010
Information not guaranteed. © 2009-2010 Terradatum and its suppliers and licensors (www.terradatum.com/about/licensors.td).
1 of 6
- 2. Valarie Littles Ultima Real Estate
Median For Sale vs. Median Sold
Aug-09 vs. Aug-10: The median price of for sale properties is down 2% and the median price of sold properties is up 20%
For Sale # Properties Sold # Properties Price
Time Period Median For Sale Median Sold Difference
Aug-10 159,900 388 171,332 29 11,432
Jul-10 164,895 362 149,995 36 -14,900
Jun-10 164,900 369 150,000 56 -14,900
May-10 167,000 329 142,500 45 -24,500
Apr-10 161,990 359 149,800 46 -12,190
Mar-10 159,900 329 150,234 40 -9,667
Feb-10 160,000 286 146,500 32 -13,500
Jan-10 168,500 282 164,905 39 -3,595
Dec-09 169,000 273 146,900 43 -22,100
Nov-09 169,900 265 132,000 33 -37,900
Oct-09 169,900 277 138,375 40 -31,525
Sep-09 169,000 282 156,450 38 -12,550
Aug-09 163,950 300 143,045 52 -20,905
Clarus MarketMetrics® 2 of 2 09/13/2010
Information not guaranteed. © 2009-2010 Terradatum and its suppliers and licensors (www.terradatum.com/about/licensors.td).
2 of 6
- 3. Valarie Littles Ultima Real Estate
Supply & Demand by Month
Aug-09 vs. Aug-10: The number of for sale properties is up 29% and the number of sold properties is down 44%
Aug-09 vs. Aug-10 Aug-09 vs. Aug-10
Aug-09 Aug-10 Change % Aug-09 Aug-10 Change %
300 388 88 +29% 52 29 -23 -44%
MLS: NTREIS Period: 1 year (monthly) Price: All Construction Type: All Bedrooms: All Bathrooms: All Lot Size: All
Property Types: Residential: (Single Family) Sq Ft: All
Cities: Forney
Clarus MarketMetrics® 1 of 2 09/13/2010
Information not guaranteed. © 2009-2010 Terradatum and its suppliers and licensors (www.terradatum.com/about/licensors.td).
3 of 6
- 4. Valarie Littles Ultima Real Estate
Supply & Demand by Month
Aug-09 vs. Aug-10: The number of for sale properties is up 29% and the number of sold properties is down 44%
# Properties Average DOM # Properties Average DOM
Time Period For Sale For Sale Sold Sold
Aug-10 388 109 29 88
Jul-10 362 133 36 85
Jun-10 369 144 56 77
May-10 329 161 45 73
Apr-10 359 158 46 98
Mar-10 329 167 40 71
Feb-10 286 178 32 81
Jan-10 282 179 39 79
Dec-09 273 186 43 65
Nov-09 265 189 33 69
Oct-09 277 188 40 93
Sep-09 282 193 38 64
Aug-09 300 183 52 79
Clarus MarketMetrics® 2 of 2 09/13/2010
Information not guaranteed. © 2009-2010 Terradatum and its suppliers and licensors (www.terradatum.com/about/licensors.td).
4 of 6
- 5. Valarie Littles Ultima Real Estate
Months Supply of Inventory
Aug-09 vs. Aug-10: The average months supply of inventory is up 87%
Aug-09 vs. Aug-10
Aug-09 Aug-10 Change %
5.7 10.7 5.0 +87%
MLS: NTREIS Period: 1 year (monthly) Price: All Construction Type: All Bedrooms: All Bathrooms: All Lot Size: All
Property Types: Residential: (Single Family) Sq Ft: All
Cities: Forney
Clarus MarketMetrics® 1 of 2 09/13/2010
Information not guaranteed. © 2009-2010 Terradatum and its suppliers and licensors (www.terradatum.com/about/licensors.td).
5 of 6
- 6. Valarie Littles Ultima Real Estate
Months Supply of Inventory
Aug-09 vs. Aug-10: The average months supply of inventory is up 87%
# Units For Sale # UC Units UC Average
Time Period Last Day of Month During Month MSI DOM
Aug-10 320 30 10.7 71
Jul-10 292 44 6.6 110
Jun-10 300 44 6.8 86
May-10 271 35 7.7 84
Apr-10 270 66 4.1 73
Mar-10 261 46 5.7 84
Feb-10 243 28 8.7 74
Jan-10 198 50 4.0 74
Dec-09 212 32 6.6 67
Nov-09 213 36 5.9 80
Oct-09 204 47 4.3 85
Sep-09 215 42 5.1 94
Aug-09 228 40 5.7 60
Clarus MarketMetrics® 2 of 2 09/13/2010
Information not guaranteed. © 2009-2010 Terradatum and its suppliers and licensors (www.terradatum.com/about/licensors.td).
6 of 6