More Related Content
Similar to Rowlett TX - Housing Market Report - November 2010
Similar to Rowlett TX - Housing Market Report - November 2010 (15)
More from Valarie Littles
More from Valarie Littles (14)
Rowlett TX - Housing Market Report - November 2010
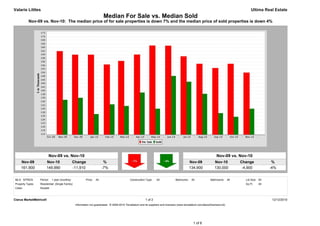
- 1. Valarie Littles Ultima Real Estate
Median For Sale vs. Median Sold
Nov-09 vs. Nov-10: The median price of for sale properties is down 7% and the median price of sold properties is down 4%
Nov-09 vs. Nov-10 Nov-09 vs. Nov-10
Nov-09 Nov-10 Change % Nov-09 Nov-10 Change %
161,900 149,990 -11,910 -7% 134,900 130,000 -4,900 -4%
MLS: NTREIS Period: 1 year (monthly) Price: All Construction Type: All Bedrooms: All Bathrooms: All Lot Size: All
Property Types: Residential: (Single Family) Sq Ft: All
Cities: Rowlett
Clarus MarketMetrics® 1 of 2 12/12/2010
Information not guaranteed. © 2009-2010 Terradatum and its suppliers and licensors (www.terradatum.com/about/licensors.td).
1 of 6
- 2. Valarie Littles Ultima Real Estate
Median For Sale vs. Median Sold
Nov-09 vs. Nov-10: The median price of for sale properties is down 7% and the median price of sold properties is down 4%
For Sale # Properties Sold # Properties Price
Time Period Median For Sale Median Sold Difference
Nov-10 149,990 475 130,000 29 -19,990
Oct-10 154,900 479 125,500 32 -29,400
Sep-10 152,500 477 127,500 43 -25,000
Aug-10 154,900 473 138,250 56 -16,650
Jul-10 159,000 448 144,900 51 -14,100
Jun-10 164,900 435 148,150 78 -16,750
May-10 164,995 392 130,000 79 -34,995
Apr-10 160,000 435 138,950 74 -21,050
Mar-10 156,450 404 131,500 69 -24,950
Feb-10 154,500 375 132,400 40 -22,100
Jan-10 159,900 365 127,000 38 -32,900
Dec-09 159,900 335 136,000 45 -23,900
Nov-09 161,900 335 134,900 65 -27,000
Clarus MarketMetrics® 2 of 2 12/12/2010
Information not guaranteed. © 2009-2010 Terradatum and its suppliers and licensors (www.terradatum.com/about/licensors.td).
2 of 6
- 3. Valarie Littles Ultima Real Estate
Supply & Demand by Month
Nov-09 vs. Nov-10: The number of for sale properties is up 42% and the number of sold properties is down 55%
Nov-09 vs. Nov-10 Nov-09 vs. Nov-10
Nov-09 Nov-10 Change % Nov-09 Nov-10 Change %
335 475 140 +42% 65 29 -36 -55%
MLS: NTREIS Period: 1 year (monthly) Price: All Construction Type: All Bedrooms: All Bathrooms: All Lot Size: All
Property Types: Residential: (Single Family) Sq Ft: All
Cities: Rowlett
Clarus MarketMetrics® 1 of 2 12/12/2010
Information not guaranteed. © 2009-2010 Terradatum and its suppliers and licensors (www.terradatum.com/about/licensors.td).
3 of 6
- 4. Valarie Littles Ultima Real Estate
Supply & Demand by Month
Nov-09 vs. Nov-10: The number of for sale properties is up 42% and the number of sold properties is down 55%
# Properties Average DOM # Properties Average DOM
Time Period For Sale For Sale Sold Sold
Nov-10 475 116 29 80
Oct-10 479 132 32 64
Sep-10 477 144 43 76
Aug-10 473 150 56 56
Jul-10 448 160 51 61
Jun-10 435 162 78 85
May-10 392 168 79 58
Apr-10 435 156 74 58
Mar-10 404 163 69 69
Feb-10 375 169 40 72
Jan-10 365 175 38 46
Dec-09 335 179 45 88
Nov-09 335 185 65 52
Clarus MarketMetrics® 2 of 2 12/12/2010
Information not guaranteed. © 2009-2010 Terradatum and its suppliers and licensors (www.terradatum.com/about/licensors.td).
4 of 6
- 5. Valarie Littles Ultima Real Estate
Months Supply of Inventory
Nov-09 vs. Nov-10: The average months supply of inventory is up 40%
Nov-09 vs. Nov-10
Nov-09 Nov-10 Change %
6.3 8.8 2.5 +40%
MLS: NTREIS Period: 1 year (monthly) Price: All Construction Type: All Bedrooms: All Bathrooms: All Lot Size: All
Property Types: Residential: (Single Family) Sq Ft: All
Cities: Rowlett
Clarus MarketMetrics® 1 of 2 12/12/2010
Information not guaranteed. © 2009-2010 Terradatum and its suppliers and licensors (www.terradatum.com/about/licensors.td).
5 of 6
- 6. Valarie Littles Ultima Real Estate
Months Supply of Inventory
Nov-09 vs. Nov-10: The average months supply of inventory is up 40%
# Units For Sale # UC Units UC Average
Time Period Last Day of Month During Month MSI DOM
Nov-10 361 41 8.8 72
Oct-10 388 34 11.4 86
Sep-10 394 34 11.6 68
Aug-10 381 45 8.5 75
Jul-10 351 51 6.9 70
Jun-10 336 57 5.9 52
May-10 317 45 7.0 67
Apr-10 286 106 2.7 60
Mar-10 298 77 3.9 73
Feb-10 285 61 4.7 70
Jan-10 279 53 5.3 72
Dec-09 263 39 6.7 51
Nov-09 257 41 6.3 88
Clarus MarketMetrics® 2 of 2 12/12/2010
Information not guaranteed. © 2009-2010 Terradatum and its suppliers and licensors (www.terradatum.com/about/licensors.td).
6 of 6