More Related Content
Similar to Little Elm - Feb/March 2011 - Housing Market Report
Similar to Little Elm - Feb/March 2011 - Housing Market Report (12)
More from Valarie Littles
More from Valarie Littles (8)
Little Elm - Feb/March 2011 - Housing Market Report
- 1. Valarie Littles Ultima Real Estate
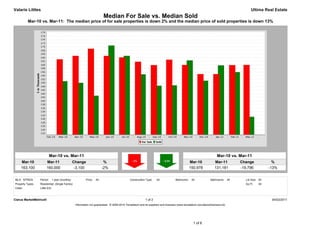
Median For Sale vs. Median Sold
Mar-10 vs. Mar-11: The median price of for sale properties is down 2% and the median price of sold properties is down 13%
Mar-10 vs. Mar-11 Mar-10 vs. Mar-11
Mar-10 Mar-11 Change % Mar-10 Mar-11 Change %
163,100 160,000 -3,100 -2% 150,978 131,181 -19,796 -13%
MLS: NTREIS Period: 1 year (monthly) Price: All Construction Type: All Bedrooms: All Bathrooms: All Lot Size: All
Property Types: Residential: (Single Family) Sq Ft: All
Cities: Little Elm
Clarus MarketMetrics® 1 of 2 04/02/2011
Information not guaranteed. © 2009-2010 Terradatum and its suppliers and licensors (www.terradatum.com/about/licensors.td).
1 of 6
- 2. Valarie Littles Ultima Real Estate
Median For Sale vs. Median Sold
Mar-10 vs. Mar-11: The median price of for sale properties is down 2% and the median price of sold properties is down 13%
For Sale # Properties Sold # Properties Price
Time Period Median For Sale Median Sold Difference
Mar-11 160,000 423 131,181 41 -28,819
Feb-11 159,900 385 156,000 31 -3,900
Jan-11 154,900 379 159,750 26 4,850
Dec-10 154,900 395 151,250 52 -3,650
Nov-10 159,976 405 162,500 43 2,524
Oct-10 162,900 415 148,654 43 -14,246
Sep-10 159,900 444 148,425 42 -11,475
Aug-10 161,750 434 154,745 44 -7,005
Jul-10 164,142 432 165,000 41 858
Jun-10 164,995 424 170,750 72 5,755
May-10 169,000 388 142,925 82 -26,075
Apr-10 165,000 417 150,000 105 -15,000
Mar-10 163,100 412 150,978 76 -12,123
Clarus MarketMetrics® 2 of 2 04/02/2011
Information not guaranteed. © 2009-2010 Terradatum and its suppliers and licensors (www.terradatum.com/about/licensors.td).
2 of 6
- 3. Valarie Littles Ultima Real Estate
Supply & Demand by Month
Mar-10 vs. Mar-11: The number of for sale properties is up 3% and the number of sold properties is down 46%
Mar-10 vs. Mar-11 Mar-10 vs. Mar-11
Mar-10 Mar-11 Change % Mar-10 Mar-11 Change %
412 423 11 +3% 76 41 -35 -46%
MLS: NTREIS Period: 1 year (monthly) Price: All Construction Type: All Bedrooms: All Bathrooms: All Lot Size: All
Property Types: Residential: (Single Family) Sq Ft: All
Cities: Little Elm
Clarus MarketMetrics® 1 of 2 04/02/2011
Information not guaranteed. © 2009-2010 Terradatum and its suppliers and licensors (www.terradatum.com/about/licensors.td).
3 of 6
- 4. Valarie Littles Ultima Real Estate
Supply & Demand by Month
Mar-10 vs. Mar-11: The number of for sale properties is up 3% and the number of sold properties is down 46%
# Properties Average DOM # Properties Average DOM
Time Period For Sale For Sale Sold Sold
Mar-11 423 95 41 92
Feb-11 385 124 31 96
Jan-11 379 144 26 87
Dec-10 395 154 52 79
Nov-10 405 162 43 72
Oct-10 415 164 43 65
Sep-10 444 166 42 60
Aug-10 434 167 44 86
Jul-10 432 170 41 54
Jun-10 424 166 72 44
May-10 388 188 82 66
Apr-10 417 178 105 56
Mar-10 412 175 76 54
Clarus MarketMetrics® 2 of 2 04/02/2011
Information not guaranteed. © 2009-2010 Terradatum and its suppliers and licensors (www.terradatum.com/about/licensors.td).
4 of 6
- 5. Valarie Littles Ultima Real Estate
Months Supply of Inventory
Mar-10 vs. Mar-11: The average months supply of inventory is up 13%
Mar-10 vs. Mar-11
Mar-10 Mar-11 Change %
3.1 3.5 0.4 +13%
MLS: NTREIS Period: 1 year (monthly) Price: All Construction Type: All Bedrooms: All Bathrooms: All Lot Size: All
Property Types: Residential: (Single Family) Sq Ft: All
Cities: Little Elm
Clarus MarketMetrics® 1 of 2 04/02/2011
Information not guaranteed. © 2009-2010 Terradatum and its suppliers and licensors (www.terradatum.com/about/licensors.td).
5 of 6
- 6. Valarie Littles Ultima Real Estate
Months Supply of Inventory
Mar-10 vs. Mar-11: The average months supply of inventory is up 13%
# Units For Sale # UC Units UC Average
Time Period Last Day of Month During Month MSI DOM
Mar-11 308 88 3.5 71
Feb-11 305 54 5.6 94
Jan-11 288 36 8.0 88
Dec-10 302 34 8.9 104
Nov-10 312 50 6.2 80
Oct-10 330 45 7.3 79
Sep-10 345 45 7.7 66
Aug-10 343 43 8.0 60
Jul-10 351 42 8.4 79
Jun-10 332 54 6.1 64
May-10 314 33 9.5 49
Apr-10 279 104 2.7 64
Mar-10 288 93 3.1 51
Clarus MarketMetrics® 2 of 2 04/02/2011
Information not guaranteed. © 2009-2010 Terradatum and its suppliers and licensors (www.terradatum.com/about/licensors.td).
6 of 6