More Related Content
Similar to Heath TX - Feb/March 2011 - Housing Market Report
Similar to Heath TX - Feb/March 2011 - Housing Market Report (15)
Heath TX - Feb/March 2011 - Housing Market Report
- 1. Valarie Littles Ultima Real Estate
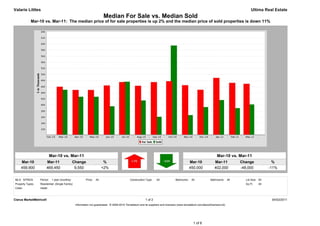
Median For Sale vs. Median Sold
Mar-10 vs. Mar-11: The median price of for sale properties is up 2% and the median price of sold properties is down 11%
Mar-10 vs. Mar-11 Mar-10 vs. Mar-11
Mar-10 Mar-11 Change % Mar-10 Mar-11 Change %
459,900 469,450 9,550 +2% 450,000 402,000 -48,000 -11%
MLS: NTREIS Period: 1 year (monthly) Price: All Construction Type: All Bedrooms: All Bathrooms: All Lot Size: All
Property Types: Residential: (Single Family) Sq Ft: All
Cities: Heath
Clarus MarketMetrics® 1 of 2 04/02/2011
Information not guaranteed. © 2009-2010 Terradatum and its suppliers and licensors (www.terradatum.com/about/licensors.td).
1 of 6
- 2. Valarie Littles Ultima Real Estate
Median For Sale vs. Median Sold
Mar-10 vs. Mar-11: The median price of for sale properties is up 2% and the median price of sold properties is down 11%
For Sale # Properties Sold # Properties Price
Time Period Median For Sale Median Sold Difference
Mar-11 469,450 154 402,000 12 -67,450
Feb-11 472,450 136 390,000 11 -82,450
Jan-11 489,000 127 416,250 10 -72,750
Dec-10 450,000 132 393,375 8 -56,625
Nov-10 465,000 137 367,000 9 -98,000
Oct-10 478,000 143 595,000 7 117,000
Sep-10 475,000 159 361,500 8 -113,500
Aug-10 463,000 161 415,000 17 -48,000
Jul-10 475,000 180 476,200 12 1,200
Jun-10 464,000 184 396,000 19 -68,000
May-10 449,450 170 427,000 9 -22,450
Apr-10 449,450 166 427,000 9 -22,450
Mar-10 459,900 151 450,000 9 -9,900
Clarus MarketMetrics® 2 of 2 04/02/2011
Information not guaranteed. © 2009-2010 Terradatum and its suppliers and licensors (www.terradatum.com/about/licensors.td).
2 of 6
- 3. Valarie Littles Ultima Real Estate
Supply & Demand by Month
Mar-10 vs. Mar-11: The number of for sale properties is up 2% and the number of sold properties is up 33%
Mar-10 vs. Mar-11 Mar-10 vs. Mar-11
Mar-10 Mar-11 Change % Mar-10 Mar-11 Change %
151 154 3 +2% 9 12 3 +33%
MLS: NTREIS Period: 1 year (monthly) Price: All Construction Type: All Bedrooms: All Bathrooms: All Lot Size: All
Property Types: Residential: (Single Family) Sq Ft: All
Cities: Heath
Clarus MarketMetrics® 1 of 2 04/02/2011
Information not guaranteed. © 2009-2010 Terradatum and its suppliers and licensors (www.terradatum.com/about/licensors.td).
3 of 6
- 4. Valarie Littles Ultima Real Estate
Supply & Demand by Month
Mar-10 vs. Mar-11: The number of for sale properties is up 2% and the number of sold properties is up 33%
# Properties Average DOM # Properties Average DOM
Time Period For Sale For Sale Sold Sold
Mar-11 154 129 12 88
Feb-11 136 154 11 224
Jan-11 127 179 10 140
Dec-10 132 203 8 168
Nov-10 137 207 9 84
Oct-10 143 210 7 78
Sep-10 159 220 8 138
Aug-10 161 223 17 126
Jul-10 180 212 12 113
Jun-10 184 222 19 117
May-10 170 226 9 109
Apr-10 166 225 9 70
Mar-10 151 237 9 93
Clarus MarketMetrics® 2 of 2 04/02/2011
Information not guaranteed. © 2009-2010 Terradatum and its suppliers and licensors (www.terradatum.com/about/licensors.td).
4 of 6
- 5. Valarie Littles Ultima Real Estate
Months Supply of Inventory
Mar-10 vs. Mar-11: The average months supply of inventory is down 13%
Mar-10 vs. Mar-11
Mar-10 Mar-11 Change %
12.9 11.2 -1.7 -13%
MLS: NTREIS Period: 1 year (monthly) Price: All Construction Type: All Bedrooms: All Bathrooms: All Lot Size: All
Property Types: Residential: (Single Family) Sq Ft: All
Cities: Heath
Clarus MarketMetrics® 1 of 2 04/02/2011
Information not guaranteed. © 2009-2010 Terradatum and its suppliers and licensors (www.terradatum.com/about/licensors.td).
5 of 6
- 6. Valarie Littles Ultima Real Estate
Months Supply of Inventory
Mar-10 vs. Mar-11: The average months supply of inventory is down 13%
# Units For Sale # UC Units UC Average
Time Period Last Day of Month During Month MSI DOM
Mar-11 134 12 11.2 114
Feb-11 123 6 20.5 90
Jan-11 106 12 8.8 115
Dec-10 101 10 10.1 211
Nov-10 115 8 14.4 82
Oct-10 118 11 10.7 107
Sep-10 122 8 15.2 155
Aug-10 135 7 19.3 116
Jul-10 142 22 6.5 120
Jun-10 157 8 19.6 188
May-10 146 15 9.7 87
Apr-10 136 16 8.5 107
Mar-10 129 10 12.9 74
Clarus MarketMetrics® 2 of 2 04/02/2011
Information not guaranteed. © 2009-2010 Terradatum and its suppliers and licensors (www.terradatum.com/about/licensors.td).
6 of 6