More Related Content
Similar to Plano TX - Feb/March 2011 - Housing Market Report
Similar to Plano TX - Feb/March 2011 - Housing Market Report (14)
More from Valarie Littles
More from Valarie Littles (7)
Plano TX - Feb/March 2011 - Housing Market Report
- 1. Valarie Littles Ultima Real Estate
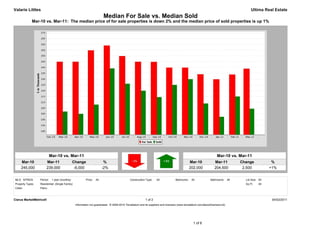
Median For Sale vs. Median Sold
Mar-10 vs. Mar-11: The median price of for sale properties is down 2% and the median price of sold properties is up 1%
Mar-10 vs. Mar-11 Mar-10 vs. Mar-11
Mar-10 Mar-11 Change % Mar-10 Mar-11 Change %
245,000 239,000 -6,000 -2% 202,000 204,500 2,500 +1%
MLS: NTREIS Period: 1 year (monthly) Price: All Construction Type: All Bedrooms: All Bathrooms: All Lot Size: All
Property Types: Residential: (Single Family) Sq Ft: All
Cities: Plano
Clarus MarketMetrics® 1 of 2 04/02/2011
Information not guaranteed. © 2009-2010 Terradatum and its suppliers and licensors (www.terradatum.com/about/licensors.td).
1 of 6
- 2. Valarie Littles Ultima Real Estate
Median For Sale vs. Median Sold
Mar-10 vs. Mar-11: The median price of for sale properties is down 2% and the median price of sold properties is up 1%
For Sale # Properties Sold # Properties Price
Time Period Median For Sale Median Sold Difference
Mar-11 239,000 1,330 204,500 180 -34,500
Feb-11 234,000 1,173 215,000 135 -19,000
Jan-11 229,900 1,199 197,500 119 -32,400
Dec-10 234,200 1,236 209,000 176 -25,200
Nov-10 239,900 1,381 230,000 150 -9,900
Oct-10 239,900 1,467 225,000 155 -14,900
Sep-10 244,900 1,561 214,450 176 -30,450
Aug-10 245,000 1,647 220,000 209 -25,000
Jul-10 249,900 1,635 226,000 218 -23,900
Jun-10 259,000 1,552 239,250 276 -19,750
May-10 254,900 1,447 208,000 255 -46,900
Apr-10 245,000 1,555 200,000 269 -45,000
Mar-10 245,000 1,415 202,000 212 -43,000
Clarus MarketMetrics® 2 of 2 04/02/2011
Information not guaranteed. © 2009-2010 Terradatum and its suppliers and licensors (www.terradatum.com/about/licensors.td).
2 of 6
- 3. Valarie Littles Ultima Real Estate
Supply & Demand by Month
Mar-10 vs. Mar-11: The number of for sale properties is down 6% and the number of sold properties is down 15%
Mar-10 vs. Mar-11 Mar-10 vs. Mar-11
Mar-10 Mar-11 Change % Mar-10 Mar-11 Change %
1,415 1,330 -85 -6% 212 180 -32 -15%
MLS: NTREIS Period: 1 year (monthly) Price: All Construction Type: All Bedrooms: All Bathrooms: All Lot Size: All
Property Types: Residential: (Single Family) Sq Ft: All
Cities: Plano
Clarus MarketMetrics® 1 of 2 04/02/2011
Information not guaranteed. © 2009-2010 Terradatum and its suppliers and licensors (www.terradatum.com/about/licensors.td).
3 of 6
- 4. Valarie Littles Ultima Real Estate
Supply & Demand by Month
Mar-10 vs. Mar-11: The number of for sale properties is down 6% and the number of sold properties is down 15%
# Properties Average DOM # Properties Average DOM
Time Period For Sale For Sale Sold Sold
Mar-11 1,330 93 180 93
Feb-11 1,173 125 135 86
Jan-11 1,199 141 119 97
Dec-10 1,236 158 176 87
Nov-10 1,381 162 150 80
Oct-10 1,467 164 155 77
Sep-10 1,561 163 176 63
Aug-10 1,647 161 209 62
Jul-10 1,635 158 218 60
Jun-10 1,552 160 276 62
May-10 1,447 163 255 53
Apr-10 1,555 152 269 53
Mar-10 1,415 156 212 67
Clarus MarketMetrics® 2 of 2 04/02/2011
Information not guaranteed. © 2009-2010 Terradatum and its suppliers and licensors (www.terradatum.com/about/licensors.td).
4 of 6
- 5. Valarie Littles Ultima Real Estate
Months Supply of Inventory
Mar-10 vs. Mar-11: The average months supply of inventory is up 20%
Mar-10 vs. Mar-11
Mar-10 Mar-11 Change %
3.7 4.4 0.7 +20%
MLS: NTREIS Period: 1 year (monthly) Price: All Construction Type: All Bedrooms: All Bathrooms: All Lot Size: All
Property Types: Residential: (Single Family) Sq Ft: All
Cities: Plano
Clarus MarketMetrics® 1 of 2 04/02/2011
Information not guaranteed. © 2009-2010 Terradatum and its suppliers and licensors (www.terradatum.com/about/licensors.td).
5 of 6
- 6. Valarie Littles Ultima Real Estate
Months Supply of Inventory
Mar-10 vs. Mar-11: The average months supply of inventory is up 20%
# Units For Sale # UC Units UC Average
Time Period Last Day of Month During Month MSI DOM
Mar-11 987 223 4.4 85
Feb-11 895 174 5.1 88
Jan-11 914 163 5.6 89
Dec-10 914 139 6.6 99
Nov-10 1,038 145 7.2 77
Oct-10 1,146 149 7.7 85
Sep-10 1,194 175 6.8 78
Aug-10 1,250 192 6.5 63
Jul-10 1,278 205 6.2 63
Jun-10 1,184 217 5.5 64
May-10 1,135 173 6.6 62
Apr-10 1,089 344 3.2 53
Mar-10 1,018 275 3.7 50
Clarus MarketMetrics® 2 of 2 04/02/2011
Information not guaranteed. © 2009-2010 Terradatum and its suppliers and licensors (www.terradatum.com/about/licensors.td).
6 of 6