More Related Content
Similar to Rowlett TX - Feb/March 2011 - Housing Market Report
Similar to Rowlett TX - Feb/March 2011 - Housing Market Report (13)
Rowlett TX - Feb/March 2011 - Housing Market Report
- 1. Valarie Littles Ultima Real Estate
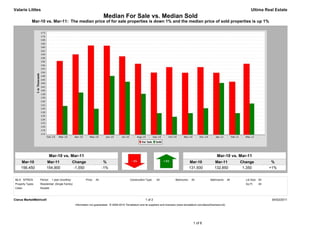
Median For Sale vs. Median Sold
Mar-10 vs. Mar-11: The median price of for sale properties is down 1% and the median price of sold properties is up 1%
Mar-10 vs. Mar-11 Mar-10 vs. Mar-11
Mar-10 Mar-11 Change % Mar-10 Mar-11 Change %
156,450 154,900 -1,550 -1% 131,500 132,850 1,350 +1%
MLS: NTREIS Period: 1 year (monthly) Price: All Construction Type: All Bedrooms: All Bathrooms: All Lot Size: All
Property Types: Residential: (Single Family) Sq Ft: All
Cities: Rowlett
Clarus MarketMetrics® 1 of 2 04/02/2011
Information not guaranteed. © 2009-2010 Terradatum and its suppliers and licensors (www.terradatum.com/about/licensors.td).
1 of 6
- 2. Valarie Littles Ultima Real Estate
Median For Sale vs. Median Sold
Mar-10 vs. Mar-11: The median price of for sale properties is down 1% and the median price of sold properties is up 1%
For Sale # Properties Sold # Properties Price
Time Period Median For Sale Median Sold Difference
Mar-11 154,900 402 132,850 43 -22,050
Feb-11 144,900 396 127,500 44 -17,400
Jan-11 149,900 430 144,250 38 -5,650
Dec-10 153,000 445 130,250 44 -22,750
Nov-10 149,900 472 127,500 35 -22,400
Oct-10 153,000 479 125,500 32 -27,500
Sep-10 149,990 477 127,500 43 -22,490
Aug-10 154,900 473 138,250 56 -16,650
Jul-10 159,000 447 144,900 51 -14,100
Jun-10 164,900 435 148,150 78 -16,750
May-10 165,000 393 129,950 80 -35,050
Apr-10 160,069 436 138,950 74 -21,119
Mar-10 156,450 404 131,500 69 -24,950
Clarus MarketMetrics® 2 of 2 04/02/2011
Information not guaranteed. © 2009-2010 Terradatum and its suppliers and licensors (www.terradatum.com/about/licensors.td).
2 of 6
- 3. Valarie Littles Ultima Real Estate
Supply & Demand by Month
Mar-10 vs. Mar-11: The number of for sale properties is down 0% and the number of sold properties is down 38%
Mar-10 vs. Mar-11 Mar-10 vs. Mar-11
Mar-10 Mar-11 Change % Mar-10 Mar-11 Change %
404 402 -2 -0% 69 43 -26 -38%
MLS: NTREIS Period: 1 year (monthly) Price: All Construction Type: All Bedrooms: All Bathrooms: All Lot Size: All
Property Types: Residential: (Single Family) Sq Ft: All
Cities: Rowlett
Clarus MarketMetrics® 1 of 2 04/02/2011
Information not guaranteed. © 2009-2010 Terradatum and its suppliers and licensors (www.terradatum.com/about/licensors.td).
3 of 6
- 4. Valarie Littles Ultima Real Estate
Supply & Demand by Month
Mar-10 vs. Mar-11: The number of for sale properties is down 0% and the number of sold properties is down 38%
# Properties Average DOM # Properties Average DOM
Time Period For Sale For Sale Sold Sold
Mar-11 402 109 43 92
Feb-11 396 134 44 69
Jan-11 430 146 38 81
Dec-10 445 162 44 70
Nov-10 472 165 35 74
Oct-10 479 171 32 64
Sep-10 477 175 43 76
Aug-10 473 175 56 56
Jul-10 447 179 51 61
Jun-10 435 175 78 85
May-10 393 181 80 58
Apr-10 436 165 74 58
Mar-10 404 169 69 69
Clarus MarketMetrics® 2 of 2 04/02/2011
Information not guaranteed. © 2009-2010 Terradatum and its suppliers and licensors (www.terradatum.com/about/licensors.td).
4 of 6
- 5. Valarie Littles Ultima Real Estate
Months Supply of Inventory
Mar-10 vs. Mar-11: The average months supply of inventory is up 32%
Mar-10 vs. Mar-11
Mar-10 Mar-11 Change %
3.9 5.1 1.2 +32%
MLS: NTREIS Period: 1 year (monthly) Price: All Construction Type: All Bedrooms: All Bathrooms: All Lot Size: All
Property Types: Residential: (Single Family) Sq Ft: All
Cities: Rowlett
Clarus MarketMetrics® 1 of 2 04/02/2011
Information not guaranteed. © 2009-2010 Terradatum and its suppliers and licensors (www.terradatum.com/about/licensors.td).
5 of 6
- 6. Valarie Littles Ultima Real Estate
Months Supply of Inventory
Mar-10 vs. Mar-11: The average months supply of inventory is up 32%
# Units For Sale # UC Units UC Average
Time Period Last Day of Month During Month MSI DOM
Mar-11 301 59 5.1 91
Feb-11 304 54 5.6 92
Jan-11 315 55 5.7 68
Dec-10 334 41 8.1 77
Nov-10 374 37 10.1 70
Oct-10 385 37 10.4 87
Sep-10 394 34 11.6 68
Aug-10 381 44 8.7 77
Jul-10 351 51 6.9 70
Jun-10 335 57 5.9 52
May-10 317 45 7.0 67
Apr-10 287 105 2.7 58
Mar-10 298 77 3.9 73
Clarus MarketMetrics® 2 of 2 04/02/2011
Information not guaranteed. © 2009-2010 Terradatum and its suppliers and licensors (www.terradatum.com/about/licensors.td).
6 of 6