More Related Content
Similar to Savannah TX - Housing Market Report - August 2010
Similar to Savannah TX - Housing Market Report - August 2010 (15)
More from Valarie Littles
More from Valarie Littles (18)
Savannah TX - Housing Market Report - August 2010
- 1. Valarie Littles Ultima Real Estate
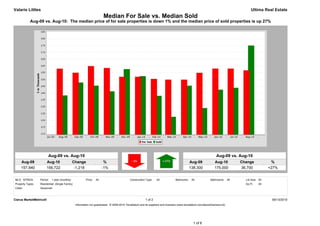
Median For Sale vs. Median Sold
Aug-09 vs. Aug-10: The median price of for sale properties is down 1% and the median price of sold properties is up 27%
Aug-09 vs. Aug-10 Aug-09 vs. Aug-10
Aug-09 Aug-10 Change % Aug-09 Aug-10 Change %
157,940 156,722 -1,218 -1% 138,300 175,000 36,700 +27%
MLS: NTREIS Period: 1 year (monthly) Price: All Construction Type: All Bedrooms: All Bathrooms: All Lot Size: All
Property Types: Residential: (Single Family) Sq Ft: All
Cities: Savannah
Clarus MarketMetrics® 1 of 2 09/13/2010
Information not guaranteed. © 2009-2010 Terradatum and its suppliers and licensors (www.terradatum.com/about/licensors.td).
1 of 6
- 2. Valarie Littles Ultima Real Estate
Median For Sale vs. Median Sold
Aug-09 vs. Aug-10: The median price of for sale properties is down 1% and the median price of sold properties is up 27%
For Sale # Properties Sold # Properties Price
Time Period Median For Sale Median Sold Difference
Aug-10 156,722 74 175,000 5 18,278
Jul-10 158,000 69 143,900 3 -14,100
Jun-10 158,000 65 142,500 9 -15,500
May-10 154,900 71 129,000 14 -25,900
Apr-10 149,900 80 145,400 12 -4,500
Mar-10 149,900 79 122,550 10 -27,350
Feb-10 150,450 66 138,000 2 -12,450
Jan-10 152,000 61 152,450 6 450
Dec-09 152,000 53 157,608 8 5,608
Nov-09 158,450 48 141,300 4 -17,151
Oct-09 159,900 51 145,455 10 -14,445
Sep-09 155,000 57 147,750 8 -7,250
Aug-09 157,940 53 138,300 5 -19,640
Clarus MarketMetrics® 2 of 2 09/13/2010
Information not guaranteed. © 2009-2010 Terradatum and its suppliers and licensors (www.terradatum.com/about/licensors.td).
2 of 6
- 3. Valarie Littles Ultima Real Estate
Supply & Demand by Month
Aug-09 vs. Aug-10: The number of for sale properties is up 40% and the number of sold properties has not changed
Aug-09 vs. Aug-10 Aug-09 vs. Aug-10
Aug-09 Aug-10 Change % Aug-09 Aug-10 Change %
53 74 21 +40% 5 5 0 0%
MLS: NTREIS Period: 1 year (monthly) Price: All Construction Type: All Bedrooms: All Bathrooms: All Lot Size: All
Property Types: Residential: (Single Family) Sq Ft: All
Cities: Savannah
Clarus MarketMetrics® 1 of 2 09/13/2010
Information not guaranteed. © 2009-2010 Terradatum and its suppliers and licensors (www.terradatum.com/about/licensors.td).
3 of 6
- 4. Valarie Littles Ultima Real Estate
Supply & Demand by Month
Aug-09 vs. Aug-10: The number of for sale properties is up 40% and the number of sold properties has not changed
# Properties Average DOM # Properties Average DOM
Time Period For Sale For Sale Sold Sold
Aug-10 74 130 5 85
Jul-10 69 152 3 53
Jun-10 65 172 9 63
May-10 71 168 14 66
Apr-10 80 171 12 58
Mar-10 79 171 10 59
Feb-10 66 183 2 30
Jan-10 61 197 6 30
Dec-09 53 202 8 79
Nov-09 48 217 4 39
Oct-09 51 214 10 101
Sep-09 57 182 8 71
Aug-09 53 209 5 64
Clarus MarketMetrics® 2 of 2 09/13/2010
Information not guaranteed. © 2009-2010 Terradatum and its suppliers and licensors (www.terradatum.com/about/licensors.td).
4 of 6
- 5. Valarie Littles Ultima Real Estate
Months Supply of Inventory
Aug-09 vs. Aug-10: The average months supply of inventory is down 35%
Aug-09 vs. Aug-10
Aug-09 Aug-10 Change %
8.6 5.6 -3.0 -35%
MLS: NTREIS Period: 1 year (monthly) Price: All Construction Type: All Bedrooms: All Bathrooms: All Lot Size: All
Property Types: Residential: (Single Family) Sq Ft: All
Cities: Savannah
Clarus MarketMetrics® 1 of 2 09/13/2010
Information not guaranteed. © 2009-2010 Terradatum and its suppliers and licensors (www.terradatum.com/about/licensors.td).
5 of 6
- 6. Valarie Littles Ultima Real Estate
Months Supply of Inventory
Aug-09 vs. Aug-10: The average months supply of inventory is down 35%
# Units For Sale # UC Units UC Average
Time Period Last Day of Month During Month MSI DOM
Aug-10 56 10 5.6 77
Jul-10 57 6 9.5 95
Jun-10 57 6 9.5 51
May-10 60 3 20.0 33
Apr-10 53 20 2.6 73
Mar-10 63 8 7.9 71
Feb-10 56 10 5.6 87
Jan-10 47 6 7.8 48
Dec-09 44 8 5.5 59
Nov-09 38 5 7.6 46
Oct-09 39 5 7.8 118
Sep-09 42 13 3.2 55
Aug-09 43 5 8.6 113
Clarus MarketMetrics® 2 of 2 09/13/2010
Information not guaranteed. © 2009-2010 Terradatum and its suppliers and licensors (www.terradatum.com/about/licensors.td).
6 of 6