More Related Content
Similar to Carrollton TX - Feb/March 2011 - Housing Market Report
Similar to Carrollton TX - Feb/March 2011 - Housing Market Report (14)
More from Valarie Littles
More from Valarie Littles (7)
Carrollton TX - Feb/March 2011 - Housing Market Report
- 1. Valarie Littles Ultima Real Estate
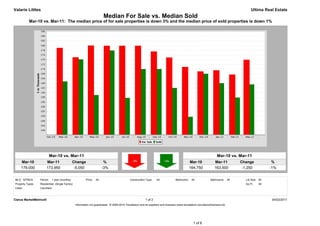
Median For Sale vs. Median Sold
Mar-10 vs. Mar-11: The median price of for sale properties is down 3% and the median price of sold properties is down 1%
Mar-10 vs. Mar-11 Mar-10 vs. Mar-11
Mar-10 Mar-11 Change % Mar-10 Mar-11 Change %
179,000 173,950 -5,050 -3% 164,750 163,500 -1,250 -1%
MLS: NTREIS Period: 1 year (monthly) Price: All Construction Type: All Bedrooms: All Bathrooms: All Lot Size: All
Property Types: Residential: (Single Family) Sq Ft: All
Cities: Carrollton
Clarus MarketMetrics® 1 of 2 04/02/2011
Information not guaranteed. © 2009-2010 Terradatum and its suppliers and licensors (www.terradatum.com/about/licensors.td).
1 of 6
- 2. Valarie Littles Ultima Real Estate
Median For Sale vs. Median Sold
Mar-10 vs. Mar-11: The median price of for sale properties is down 3% and the median price of sold properties is down 1%
For Sale # Properties Sold # Properties Price
Time Period Median For Sale Median Sold Difference
Mar-11 173,950 630 163,500 55 -10,450
Feb-11 167,700 580 157,900 51 -9,800
Jan-11 169,500 602 164,000 47 -5,500
Dec-10 169,000 621 168,000 57 -1,000
Nov-10 170,900 639 149,750 55 -21,150
Oct-10 174,900 658 162,000 79 -12,900
Sep-10 177,500 669 170,000 57 -7,500
Aug-10 179,900 675 170,000 66 -9,900
Jul-10 179,900 658 157,750 66 -22,150
Jun-10 179,900 623 177,900 99 -2,000
May-10 180,000 560 159,000 103 -21,000
Apr-10 175,000 608 174,125 126 -875
Mar-10 179,000 563 164,750 98 -14,250
Clarus MarketMetrics® 2 of 2 04/02/2011
Information not guaranteed. © 2009-2010 Terradatum and its suppliers and licensors (www.terradatum.com/about/licensors.td).
2 of 6
- 3. Valarie Littles Ultima Real Estate
Supply & Demand by Month
Mar-10 vs. Mar-11: The number of for sale properties is up 12% and the number of sold properties is down 44%
Mar-10 vs. Mar-11 Mar-10 vs. Mar-11
Mar-10 Mar-11 Change % Mar-10 Mar-11 Change %
563 630 67 +12% 98 55 -43 -44%
MLS: NTREIS Period: 1 year (monthly) Price: All Construction Type: All Bedrooms: All Bathrooms: All Lot Size: All
Property Types: Residential: (Single Family) Sq Ft: All
Cities: Carrollton
Clarus MarketMetrics® 1 of 2 04/02/2011
Information not guaranteed. © 2009-2010 Terradatum and its suppliers and licensors (www.terradatum.com/about/licensors.td).
3 of 6
- 4. Valarie Littles Ultima Real Estate
Supply & Demand by Month
Mar-10 vs. Mar-11: The number of for sale properties is up 12% and the number of sold properties is down 44%
# Properties Average DOM # Properties Average DOM
Time Period For Sale For Sale Sold Sold
Mar-11 630 95 55 83
Feb-11 580 120 51 91
Jan-11 602 136 47 82
Dec-10 621 149 57 66
Nov-10 639 155 55 78
Oct-10 658 161 79 78
Sep-10 669 160 57 68
Aug-10 675 158 66 57
Jul-10 658 159 66 66
Jun-10 623 159 99 72
May-10 560 158 103 62
Apr-10 608 147 126 57
Mar-10 563 147 98 58
Clarus MarketMetrics® 2 of 2 04/02/2011
Information not guaranteed. © 2009-2010 Terradatum and its suppliers and licensors (www.terradatum.com/about/licensors.td).
4 of 6
- 5. Valarie Littles Ultima Real Estate
Months Supply of Inventory
Mar-10 vs. Mar-11: The average months supply of inventory is up 116%
Mar-10 vs. Mar-11
Mar-10 Mar-11 Change %
2.9 6.4 3.4 +116%
MLS: NTREIS Period: 1 year (monthly) Price: All Construction Type: All Bedrooms: All Bathrooms: All Lot Size: All
Property Types: Residential: (Single Family) Sq Ft: All
Cities: Carrollton
Clarus MarketMetrics® 1 of 2 04/02/2011
Information not guaranteed. © 2009-2010 Terradatum and its suppliers and licensors (www.terradatum.com/about/licensors.td).
5 of 6
- 6. Valarie Littles Ultima Real Estate
Months Supply of Inventory
Mar-10 vs. Mar-11: The average months supply of inventory is up 116%
# Units For Sale # UC Units UC Average
Time Period Last Day of Month During Month MSI DOM
Mar-11 491 77 6.4 87
Feb-11 455 77 5.9 81
Jan-11 462 63 7.3 93
Dec-10 467 59 7.9 82
Nov-10 522 46 11.3 65
Oct-10 514 58 8.9 75
Sep-10 513 79 6.5 82
Aug-10 526 59 8.9 61
Jul-10 527 58 9.1 62
Jun-10 476 75 6.3 60
May-10 457 46 9.9 62
Apr-10 419 148 2.8 57
Mar-10 389 132 2.9 66
Clarus MarketMetrics® 2 of 2 04/02/2011
Information not guaranteed. © 2009-2010 Terradatum and its suppliers and licensors (www.terradatum.com/about/licensors.td).
6 of 6