More Related Content
Similar to Forney TX - Housing Market Report - November 2010
Similar to Forney TX - Housing Market Report - November 2010 (15)
More from Valarie Littles
More from Valarie Littles (14)
Forney TX - Housing Market Report - November 2010
- 1. Valarie Littles Ultima Real Estate
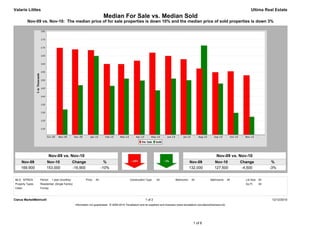
Median For Sale vs. Median Sold
Nov-09 vs. Nov-10: The median price of for sale properties is down 10% and the median price of sold properties is down 3%
Nov-09 vs. Nov-10 Nov-09 vs. Nov-10
Nov-09 Nov-10 Change % Nov-09 Nov-10 Change %
169,900 153,000 -16,900 -10% 132,000 127,500 -4,500 -3%
MLS: NTREIS Period: 1 year (monthly) Price: All Construction Type: All Bedrooms: All Bathrooms: All Lot Size: All
Property Types: Residential: (Single Family) Sq Ft: All
Cities: Forney
Clarus MarketMetrics® 1 of 2 12/12/2010
Information not guaranteed. © 2009-2010 Terradatum and its suppliers and licensors (www.terradatum.com/about/licensors.td).
1 of 6
- 2. Valarie Littles Ultima Real Estate
Median For Sale vs. Median Sold
Nov-09 vs. Nov-10: The median price of for sale properties is down 10% and the median price of sold properties is down 3%
For Sale # Properties Sold # Properties Price
Time Period Median For Sale Median Sold Difference
Nov-10 153,000 359 127,500 28 -25,500
Oct-10 155,450 390 129,900 27 -25,550
Sep-10 154,900 406 147,913 32 -6,987
Aug-10 157,145 396 171,332 31 14,187
Jul-10 162,903 365 150,000 41 -12,903
Jun-10 164,900 368 151,013 59 -13,887
May-10 166,900 327 143,745 46 -23,155
Apr-10 161,990 357 149,800 46 -12,190
Mar-10 159,900 328 151,000 41 -8,900
Feb-10 160,000 286 146,500 32 -13,500
Jan-10 168,500 282 164,905 39 -3,595
Dec-09 169,000 273 146,900 43 -22,100
Nov-09 169,900 265 132,000 33 -37,900
Clarus MarketMetrics® 2 of 2 12/12/2010
Information not guaranteed. © 2009-2010 Terradatum and its suppliers and licensors (www.terradatum.com/about/licensors.td).
2 of 6
- 3. Valarie Littles Ultima Real Estate
Supply & Demand by Month
Nov-09 vs. Nov-10: The number of for sale properties is up 35% and the number of sold properties is down 15%
Nov-09 vs. Nov-10 Nov-09 vs. Nov-10
Nov-09 Nov-10 Change % Nov-09 Nov-10 Change %
265 359 94 +35% 33 28 -5 -15%
MLS: NTREIS Period: 1 year (monthly) Price: All Construction Type: All Bedrooms: All Bathrooms: All Lot Size: All
Property Types: Residential: (Single Family) Sq Ft: All
Cities: Forney
Clarus MarketMetrics® 1 of 2 12/12/2010
Information not guaranteed. © 2009-2010 Terradatum and its suppliers and licensors (www.terradatum.com/about/licensors.td).
3 of 6
- 4. Valarie Littles Ultima Real Estate
Supply & Demand by Month
Nov-09 vs. Nov-10: The number of for sale properties is up 35% and the number of sold properties is down 15%
# Properties Average DOM # Properties Average DOM
Time Period For Sale For Sale Sold Sold
Nov-10 359 125 28 80
Oct-10 390 138 27 68
Sep-10 406 151 32 79
Aug-10 396 158 31 96
Jul-10 365 173 41 88
Jun-10 368 175 59 77
May-10 327 186 46 72
Apr-10 357 177 46 98
Mar-10 328 177 41 70
Feb-10 286 185 32 81
Jan-10 282 186 39 79
Dec-09 273 192 43 65
Nov-09 265 194 33 69
Clarus MarketMetrics® 2 of 2 12/12/2010
Information not guaranteed. © 2009-2010 Terradatum and its suppliers and licensors (www.terradatum.com/about/licensors.td).
4 of 6
- 5. Valarie Littles Ultima Real Estate
Months Supply of Inventory
Nov-09 vs. Nov-10: The average months supply of inventory is up 13%
Nov-09 vs. Nov-10
Nov-09 Nov-10 Change %
5.9 6.7 0.8 +13%
MLS: NTREIS Period: 1 year (monthly) Price: All Construction Type: All Bedrooms: All Bathrooms: All Lot Size: All
Property Types: Residential: (Single Family) Sq Ft: All
Cities: Forney
Clarus MarketMetrics® 1 of 2 12/12/2010
Information not guaranteed. © 2009-2010 Terradatum and its suppliers and licensors (www.terradatum.com/about/licensors.td).
5 of 6
- 6. Valarie Littles Ultima Real Estate
Months Supply of Inventory
Nov-09 vs. Nov-10: The average months supply of inventory is up 13%
# Units For Sale # UC Units UC Average
Time Period Last Day of Month During Month MSI DOM
Nov-10 282 42 6.7 87
Oct-10 303 37 8.2 99
Sep-10 328 28 11.7 63
Aug-10 327 32 10.2 86
Jul-10 301 39 7.7 101
Jun-10 303 42 7.2 78
May-10 270 34 7.9 87
Apr-10 267 66 4.0 73
Mar-10 259 47 5.5 83
Feb-10 242 29 8.3 75
Jan-10 198 50 4.0 74
Dec-09 212 32 6.6 67
Nov-09 213 36 5.9 80
Clarus MarketMetrics® 2 of 2 12/12/2010
Information not guaranteed. © 2009-2010 Terradatum and its suppliers and licensors (www.terradatum.com/about/licensors.td).
6 of 6