More Related Content
Similar to The Colony TX - Housing Market Report - August 2010
Similar to The Colony TX - Housing Market Report - August 2010 (14)
More from Valarie Littles
More from Valarie Littles (20)
The Colony TX - Housing Market Report - August 2010
- 1. Valarie Littles Ultima Real Estate
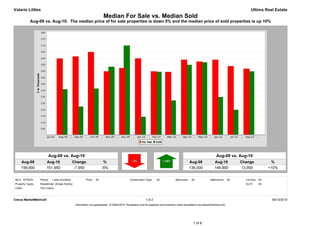
Median For Sale vs. Median Sold
Aug-09 vs. Aug-10: The median price of for sale properties is down 5% and the median price of sold properties is up 10%
Aug-09 vs. Aug-10 Aug-09 vs. Aug-10
Aug-09 Aug-10 Change % Aug-09 Aug-10 Change %
159,900 151,950 -7,950 -5% 136,000 149,900 13,900 +10%
MLS: NTREIS Period: 1 year (monthly) Price: All Construction Type: All Bedrooms: All Bathrooms: All Lot Size: All
Property Types: Residential: (Single Family) Sq Ft: All
Cities: The Colony
Clarus MarketMetrics® 1 of 2 09/13/2010
Information not guaranteed. © 2009-2010 Terradatum and its suppliers and licensors (www.terradatum.com/about/licensors.td).
1 of 6
- 2. Valarie Littles Ultima Real Estate
Median For Sale vs. Median Sold
Aug-09 vs. Aug-10: The median price of for sale properties is down 5% and the median price of sold properties is up 10%
For Sale # Properties Sold # Properties Price
Time Period Median For Sale Median Sold Difference
Aug-10 151,950 260 149,900 45 -2,050
Jul-10 154,000 273 119,950 26 -34,050
Jun-10 159,000 222 129,900 39 -29,100
May-10 157,492 190 156,950 58 -542
Apr-10 159,000 259 155,000 50 -4,000
Mar-10 149,450 248 127,250 58 -22,200
Feb-10 149,900 225 149,500 26 -400
Jan-10 160,000 217 114,500 18 -45,500
Dec-09 152,450 194 170,000 32 17,550
Nov-09 149,900 202 153,500 58 3,600
Oct-09 164,990 241 136,500 44 -28,490
Sep-09 161,500 244 122,500 50 -39,000
Aug-09 159,900 243 136,000 42 -23,900
Clarus MarketMetrics® 2 of 2 09/13/2010
Information not guaranteed. © 2009-2010 Terradatum and its suppliers and licensors (www.terradatum.com/about/licensors.td).
2 of 6
- 3. Valarie Littles Ultima Real Estate
Supply & Demand by Month
Aug-09 vs. Aug-10: The number of for sale properties is up 7% and the number of sold properties is up 7%
Aug-09 vs. Aug-10 Aug-09 vs. Aug-10
Aug-09 Aug-10 Change % Aug-09 Aug-10 Change %
243 260 17 +7% 42 45 3 +7%
MLS: NTREIS Period: 1 year (monthly) Price: All Construction Type: All Bedrooms: All Bathrooms: All Lot Size: All
Property Types: Residential: (Single Family) Sq Ft: All
Cities: The Colony
Clarus MarketMetrics® 1 of 2 09/13/2010
Information not guaranteed. © 2009-2010 Terradatum and its suppliers and licensors (www.terradatum.com/about/licensors.td).
3 of 6
- 4. Valarie Littles Ultima Real Estate
Supply & Demand by Month
Aug-09 vs. Aug-10: The number of for sale properties is up 7% and the number of sold properties is up 7%
# Properties Average DOM # Properties Average DOM
Time Period For Sale For Sale Sold Sold
Aug-10 260 89 45 52
Jul-10 273 98 26 59
Jun-10 222 119 39 68
May-10 190 133 58 55
Apr-10 259 116 50 64
Mar-10 248 122 58 66
Feb-10 225 132 26 71
Jan-10 217 141 18 57
Dec-09 194 157 32 58
Nov-09 202 150 58 61
Oct-09 241 131 44 41
Sep-09 244 128 50 63
Aug-09 243 138 42 64
Clarus MarketMetrics® 2 of 2 09/13/2010
Information not guaranteed. © 2009-2010 Terradatum and its suppliers and licensors (www.terradatum.com/about/licensors.td).
4 of 6
- 5. Valarie Littles Ultima Real Estate
Months Supply of Inventory
Aug-09 vs. Aug-10: The average months supply of inventory is up 20%
Aug-09 vs. Aug-10
Aug-09 Aug-10 Change %
4.3 5.1 0.9 +20%
MLS: NTREIS Period: 1 year (monthly) Price: All Construction Type: All Bedrooms: All Bathrooms: All Lot Size: All
Property Types: Residential: (Single Family) Sq Ft: All
Cities: The Colony
Clarus MarketMetrics® 1 of 2 09/13/2010
Information not guaranteed. © 2009-2010 Terradatum and its suppliers and licensors (www.terradatum.com/about/licensors.td).
5 of 6
- 6. Valarie Littles Ultima Real Estate
Months Supply of Inventory
Aug-09 vs. Aug-10: The average months supply of inventory is up 20%
# Units For Sale # UC Units UC Average
Time Period Last Day of Month During Month MSI DOM
Aug-10 195 38 5.1 66
Jul-10 201 48 4.2 55
Jun-10 183 24 7.6 82
May-10 154 18 8.6 56
Apr-10 147 80 1.8 49
Mar-10 172 59 2.9 70
Feb-10 151 46 3.3 59
Jan-10 162 24 6.8 64
Dec-09 152 20 7.6 72
Nov-09 153 34 4.5 56
Oct-09 149 64 2.3 55
Sep-09 168 50 3.4 54
Aug-09 175 41 4.3 72
Clarus MarketMetrics® 2 of 2 09/13/2010
Information not guaranteed. © 2009-2010 Terradatum and its suppliers and licensors (www.terradatum.com/about/licensors.td).
6 of 6