More Related Content
Similar to Frisco TX - January 2011 - Housing Market Report
Similar to Frisco TX - January 2011 - Housing Market Report (14)
More from Valarie Littles
More from Valarie Littles (9)
Frisco TX - January 2011 - Housing Market Report
- 1. Valarie Littles Ultima Real Estate
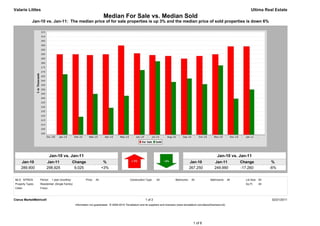
Median For Sale vs. Median Sold
Jan-10 vs. Jan-11: The median price of for sale properties is up 3% and the median price of sold properties is down 6%
Jan-10 vs. Jan-11 Jan-10 vs. Jan-11
Jan-10 Jan-11 Change % Jan-10 Jan-11 Change %
289,900 298,925 9,025 +3% 267,250 249,990 -17,260 -6%
MLS: NTREIS Period: 1 year (monthly) Price: All Construction Type: All Bedrooms: All Bathrooms: All Lot Size: All
Property Types: Residential: (Single Family) Sq Ft: All
Cities: Frisco
Clarus MarketMetrics® 1 of 2 02/21/2011
Information not guaranteed. © 2009-2010 Terradatum and its suppliers and licensors (www.terradatum.com/about/licensors.td).
1 of 6
- 2. Valarie Littles Ultima Real Estate
Median For Sale vs. Median Sold
Jan-10 vs. Jan-11: The median price of for sale properties is up 3% and the median price of sold properties is down 6%
For Sale # Properties Sold # Properties Price
Time Period Median For Sale Median Sold Difference
Jan-11 298,925 1,194 249,990 107 -48,935
Dec-10 298,900 1,196 239,495 162 -59,405
Nov-10 289,900 1,300 277,350 140 -12,550
Oct-10 288,000 1,375 256,000 155 -32,000
Sep-10 285,000 1,417 262,500 135 -22,500
Aug-10 288,000 1,477 258,490 173 -29,510
Jul-10 289,000 1,468 282,000 189 -7,000
Jun-10 291,000 1,432 272,000 261 -19,000
May-10 299,900 1,351 242,900 275 -57,000
Apr-10 289,900 1,476 229,200 268 -60,700
Mar-10 289,000 1,416 245,000 229 -44,000
Feb-10 289,900 1,255 219,000 125 -70,900
Jan-10 289,900 1,209 267,250 98 -22,650
Clarus MarketMetrics® 2 of 2 02/21/2011
Information not guaranteed. © 2009-2010 Terradatum and its suppliers and licensors (www.terradatum.com/about/licensors.td).
2 of 6
- 3. Valarie Littles Ultima Real Estate
Supply & Demand by Month
Jan-10 vs. Jan-11: The number of for sale properties is down 1% and the number of sold properties is up 9%
Jan-10 vs. Jan-11 Jan-10 vs. Jan-11
Jan-10 Jan-11 Change % Jan-10 Jan-11 Change %
1,209 1,194 -15 -1% 98 107 9 +9%
MLS: NTREIS Period: 1 year (monthly) Price: All Construction Type: All Bedrooms: All Bathrooms: All Lot Size: All
Property Types: Residential: (Single Family) Sq Ft: All
Cities: Frisco
Clarus MarketMetrics® 1 of 2 02/21/2011
Information not guaranteed. © 2009-2010 Terradatum and its suppliers and licensors (www.terradatum.com/about/licensors.td).
3 of 6
- 4. Valarie Littles Ultima Real Estate
Supply & Demand by Month
Jan-10 vs. Jan-11: The number of for sale properties is down 1% and the number of sold properties is up 9%
# Properties Average DOM # Properties Average DOM
Time Period For Sale For Sale Sold Sold
Jan-11 1,194 123 107 98
Dec-10 1,196 149 162 94
Nov-10 1,300 156 140 91
Oct-10 1,375 161 155 77
Sep-10 1,417 165 135 73
Aug-10 1,477 166 173 68
Jul-10 1,468 170 189 77
Jun-10 1,432 176 261 70
May-10 1,351 176 275 55
Apr-10 1,476 161 268 63
Mar-10 1,416 162 229 79
Feb-10 1,255 174 125 67
Jan-10 1,209 180 98 81
Clarus MarketMetrics® 2 of 2 02/21/2011
Information not guaranteed. © 2009-2010 Terradatum and its suppliers and licensors (www.terradatum.com/about/licensors.td).
4 of 6
- 5. Valarie Littles Ultima Real Estate
Months Supply of Inventory
Jan-10 vs. Jan-11: The average months supply of inventory is down 4%
Jan-10 vs. Jan-11
Jan-10 Jan-11 Change %
5.1 5.0 -0.2 -4%
MLS: NTREIS Period: 1 year (monthly) Price: All Construction Type: All Bedrooms: All Bathrooms: All Lot Size: All
Property Types: Residential: (Single Family) Sq Ft: All
Cities: Frisco
Clarus MarketMetrics® 1 of 2 02/21/2011
Information not guaranteed. © 2009-2010 Terradatum and its suppliers and licensors (www.terradatum.com/about/licensors.td).
5 of 6
- 6. Valarie Littles Ultima Real Estate
Months Supply of Inventory
Jan-10 vs. Jan-11: The average months supply of inventory is down 4%
# Units For Sale # UC Units UC Average
Time Period Last Day of Month During Month MSI DOM
Jan-11 887 179 5.0 97
Dec-10 891 137 6.5 99
Nov-10 1,035 135 7.7 101
Oct-10 1,057 171 6.2 89
Sep-10 1,116 145 7.7 80
Aug-10 1,145 164 7.0 69
Jul-10 1,170 163 7.2 78
Jun-10 1,113 177 6.3 74
May-10 1,074 164 6.5 66
Apr-10 1,029 346 3.0 59
Mar-10 1,044 275 3.8 60
Feb-10 954 203 4.7 77
Jan-10 916 178 5.1 76
Clarus MarketMetrics® 2 of 2 02/21/2011
Information not guaranteed. © 2009-2010 Terradatum and its suppliers and licensors (www.terradatum.com/about/licensors.td).
6 of 6