More Related Content
Similar to Carrollton TX - Housing Market Report - November 2010
Similar to Carrollton TX - Housing Market Report - November 2010 (15)
More from Valarie Littles
More from Valarie Littles (20)
Carrollton TX - Housing Market Report - November 2010
- 1. Valarie Littles Ultima Real Estate
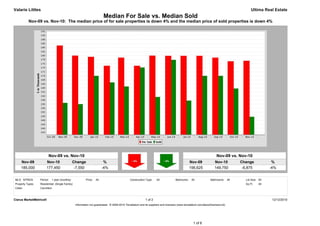
Median For Sale vs. Median Sold
Nov-09 vs. Nov-10: The median price of for sale properties is down 4% and the median price of sold properties is down 4%
Nov-09 vs. Nov-10 Nov-09 vs. Nov-10
Nov-09 Nov-10 Change % Nov-09 Nov-10 Change %
185,000 177,450 -7,550 -4% 156,625 149,750 -6,875 -4%
MLS: NTREIS Period: 1 year (monthly) Price: All Construction Type: All Bedrooms: All Bathrooms: All Lot Size: All
Property Types: Residential: (Single Family) Sq Ft: All
Cities: Carrollton
Clarus MarketMetrics® 1 of 2 12/12/2010
Information not guaranteed. © 2009-2010 Terradatum and its suppliers and licensors (www.terradatum.com/about/licensors.td).
1 of 6
- 2. Valarie Littles Ultima Real Estate
Median For Sale vs. Median Sold
Nov-09 vs. Nov-10: The median price of for sale properties is down 4% and the median price of sold properties is down 4%
For Sale # Properties Sold # Properties Price
Time Period Median For Sale Median Sold Difference
Nov-10 177,450 630 149,750 49 -27,700
Oct-10 177,200 654 163,725 77 -13,475
Sep-10 179,000 667 170,000 57 -9,000
Aug-10 179,900 674 170,000 66 -9,900
Jul-10 179,900 657 157,750 66 -22,150
Jun-10 179,900 623 177,900 99 -2,000
May-10 180,000 558 159,550 102 -20,450
Apr-10 175,000 606 174,125 126 -875
Mar-10 179,000 562 164,750 98 -14,250
Feb-10 175,000 518 166,750 68 -8,250
Jan-10 179,400 488 170,000 41 -9,400
Dec-09 180,000 449 156,000 71 -24,000
Nov-09 185,000 471 156,625 92 -28,375
Clarus MarketMetrics® 2 of 2 12/12/2010
Information not guaranteed. © 2009-2010 Terradatum and its suppliers and licensors (www.terradatum.com/about/licensors.td).
2 of 6
- 3. Valarie Littles Ultima Real Estate
Supply & Demand by Month
Nov-09 vs. Nov-10: The number of for sale properties is up 34% and the number of sold properties is down 47%
Nov-09 vs. Nov-10 Nov-09 vs. Nov-10
Nov-09 Nov-10 Change % Nov-09 Nov-10 Change %
471 630 159 +34% 92 49 -43 -47%
MLS: NTREIS Period: 1 year (monthly) Price: All Construction Type: All Bedrooms: All Bathrooms: All Lot Size: All
Property Types: Residential: (Single Family) Sq Ft: All
Cities: Carrollton
Clarus MarketMetrics® 1 of 2 12/12/2010
Information not guaranteed. © 2009-2010 Terradatum and its suppliers and licensors (www.terradatum.com/about/licensors.td).
3 of 6
- 4. Valarie Littles Ultima Real Estate
Supply & Demand by Month
Nov-09 vs. Nov-10: The number of for sale properties is up 34% and the number of sold properties is down 47%
# Properties Average DOM # Properties Average DOM
Time Period For Sale For Sale Sold Sold
Nov-10 630 104 49 81
Oct-10 654 122 77 79
Sep-10 667 132 57 68
Aug-10 674 138 66 57
Jul-10 657 145 66 66
Jun-10 623 149 99 72
May-10 558 151 102 63
Apr-10 606 142 126 57
Mar-10 562 144 98 58
Feb-10 518 152 68 67
Jan-10 488 158 41 60
Dec-09 449 170 71 76
Nov-09 471 166 92 59
Clarus MarketMetrics® 2 of 2 12/12/2010
Information not guaranteed. © 2009-2010 Terradatum and its suppliers and licensors (www.terradatum.com/about/licensors.td).
4 of 6
- 5. Valarie Littles Ultima Real Estate
Months Supply of Inventory
Nov-09 vs. Nov-10: The average months supply of inventory is up 104%
Nov-09 vs. Nov-10
Nov-09 Nov-10 Change %
6.4 13.0 6.6 +104%
MLS: NTREIS Period: 1 year (monthly) Price: All Construction Type: All Bedrooms: All Bathrooms: All Lot Size: All
Property Types: Residential: (Single Family) Sq Ft: All
Cities: Carrollton
Clarus MarketMetrics® 1 of 2 12/12/2010
Information not guaranteed. © 2009-2010 Terradatum and its suppliers and licensors (www.terradatum.com/about/licensors.td).
5 of 6
- 6. Valarie Littles Ultima Real Estate
Months Supply of Inventory
Nov-09 vs. Nov-10: The average months supply of inventory is up 104%
# Units For Sale # UC Units UC Average
Time Period Last Day of Month During Month MSI DOM
Nov-10 521 40 13.0 73
Oct-10 506 64 7.9 73
Sep-10 509 82 6.2 81
Aug-10 525 59 8.9 62
Jul-10 526 58 9.1 62
Jun-10 475 75 6.3 60
May-10 457 46 9.9 62
Apr-10 417 148 2.8 57
Mar-10 387 132 2.9 66
Feb-10 377 100 3.8 67
Jan-10 373 65 5.7 64
Dec-09 337 49 6.9 73
Nov-09 364 57 6.4 60
Clarus MarketMetrics® 2 of 2 12/12/2010
Information not guaranteed. © 2009-2010 Terradatum and its suppliers and licensors (www.terradatum.com/about/licensors.td).
6 of 6