More Related Content
Similar to McKinney TX - July 2010 Market Report
Similar to McKinney TX - July 2010 Market Report (11)
More from Valarie Littles
More from Valarie Littles (20)
McKinney TX - July 2010 Market Report
- 1. Valarie Littles Median For Sale vs. Median Sold Ultima Real Estate
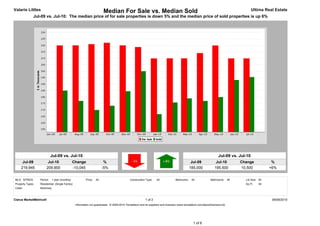
Jul-09 vs. Jul-10: The median price of for sale properties is down 5% and the median price of sold properties is up 6%
Jul-09 vs. Jul-10 Jul-09 vs. Jul-10
Jul-09 Jul-10 Change % Jul-09 Jul-10 Change %
219,945 209,900 -10,045 -5% 185,000 195,500 10,500 +6%
MLS: NTREIS Period: 1 year (monthly) Price: All Construction Type: All Bedrooms: All Bathrooms: All Lot Size: All
Property Types: Residential: (Single Family) Sq Ft: All
Cities: Mckinney
Clarus MarketMetrics® 1 of 2 08/08/2010
Information not guaranteed. © 2009-2010 Terradatum and its suppliers and licensors (www.terradatum.com/about/licensors.td).
1 of 6
- 2. Valarie Littles Median For Sale vs. Median Sold Ultima Real Estate
Jul-09 vs. Jul-10: The median price of for sale properties is down 5% and the median price of sold properties is up 6%
For Sale # Properties Sold # Properties Price
Time Period Median For Sale Median Sold Difference
Jul-10 209,900 1,543 195,500 170 -14,400
Jun-10 209,900 1,473 193,217.5 192 -16,683
May-10 219,900 1,344 180,000 221 -39,900
Apr-10 214,000 1,437 177,000 227 -37,000
Mar-10 209,945 1,332 179,000 205 -30,945
Feb-10 209,956 1,173 175,780 141 -34,176
Jan-10 209,900 1,107 166,800 105 -43,100
Dec-09 218,700 1,036 200,000 163 -18,700
Nov-09 220,000 1,094 184,500 196 -35,500
Oct-09 221,995 1,206 173,240 234 -48,755
Sep-09 220,944 1,318 170,000 209 -50,944
Aug-09 220,000 1,413 177,000 253 -43,000
Jul-09 219,945 1,508 185,000 276 -34,945
Clarus MarketMetrics® 2 of 2 08/08/2010
Information not guaranteed. © 2009-2010 Terradatum and its suppliers and licensors (www.terradatum.com/about/licensors.td).
2 of 6
- 3. Valarie Littles Supply & Demand by Month Ultima Real Estate
Jul-09 vs. Jul-10: The number of for sale properties is up 2% and the number of sold properties is down 38%
Jul-09 vs. Jul-10 Jul-09 vs. Jul-10
Jul-09 Jul-10 Change % Jul-09 Jul-10 Change %
1,508 1,543 35 +2% 276 170 -106 -38%
MLS: NTREIS Period: 1 year (monthly) Price: All Construction Type: All Bedrooms: All Bathrooms: All Lot Size: All
Property Types: Residential: (Single Family) Sq Ft: All
Cities: Mckinney
Clarus MarketMetrics® 1 of 2 08/08/2010
Information not guaranteed. © 2009-2010 Terradatum and its suppliers and licensors (www.terradatum.com/about/licensors.td).
3 of 6
- 4. Valarie Littles Supply & Demand by Month Ultima Real Estate
Jul-09 vs. Jul-10: The number of for sale properties is up 2% and the number of sold properties is down 38%
# Properties Average DOM # Properties Average DOM
Time Period For Sale For Sale Sold Sold
Jul-10 1,543 95 170 71
Jun-10 1,473 113 192 61
May-10 1,344 130 221 62
Apr-10 1,437 133 227 63
Mar-10 1,332 141 205 67
Feb-10 1,173 157 141 79
Jan-10 1,107 170 105 72
Dec-09 1,036 187 163 69
Nov-09 1,094 185 196 59
Oct-09 1,206 175 234 75
Sep-09 1,318 173 209 77
Aug-09 1,413 168 253 65
Jul-09 1,508 164 276 71
Clarus MarketMetrics® 2 of 2 08/08/2010
Information not guaranteed. © 2009-2010 Terradatum and its suppliers and licensors (www.terradatum.com/about/licensors.td).
4 of 6
- 5. Valarie Littles Months Supply of Inventory Ultima Real Estate
Jul-09 vs. Jul-10: The average months supply of inventory is up 65%
Jul-09 vs. Jul-10
Jul-09 Jul-10 Change %
3.9 6.4 2.5 +65%
MLS: NTREIS Period: 1 year (monthly) Price: All Construction Type: All Bedrooms: All Bathrooms: All Lot Size: All
Property Types: Residential: (Single Family) Sq Ft: All
Cities: Mckinney
Clarus MarketMetrics® 1 of 2 08/08/2010
Information not guaranteed. © 2009-2010 Terradatum and its suppliers and licensors (www.terradatum.com/about/licensors.td).
5 of 6
- 6. Valarie Littles Months Supply of Inventory Ultima Real Estate
Jul-09 vs. Jul-10: The average months supply of inventory is up 65%
# Units For Sale # UC Units UC Average
Time Period Last Day of Month During Month MSI DOM
Jul-10 1,212 188 6 68
Jun-10 1,168 170 7 73
May-10 1,073 137 8 68
Apr-10 1,017 305 3 58
Mar-10 987 246 4 64
Feb-10 909 181 5 69
Jan-10 828 170 5 82
Dec-09 776 117 7 91
Nov-09 853 125 7 66
Oct-09 879 202 4 57
Sep-09 937 219 4 79
Aug-09 1,018 240 4 68
Jul-09 1,093 280 4 69
Clarus MarketMetrics® 2 of 2 08/08/2010
Information not guaranteed. © 2009-2010 Terradatum and its suppliers and licensors (www.terradatum.com/about/licensors.td).
6 of 6