More Related Content
Similar to Frisco TX - Feb/March 2011 - Housing Market Report
Similar to Frisco TX - Feb/March 2011 - Housing Market Report (20)
Frisco TX - Feb/March 2011 - Housing Market Report
- 1. Valarie Littles Ultima Real Estate
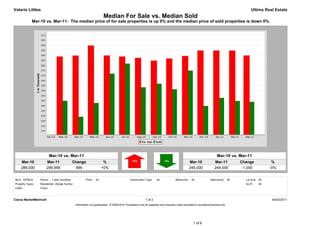
Median For Sale vs. Median Sold
Mar-10 vs. Mar-11: The median price of for sale properties is up 0% and the median price of sold properties is down 0%
Mar-10 vs. Mar-11 Mar-10 vs. Mar-11
Mar-10 Mar-11 Change % Mar-10 Mar-11 Change %
289,000 289,999 999 +0% 245,000 244,000 -1,000 -0%
MLS: NTREIS Period: 1 year (monthly) Price: All Construction Type: All Bedrooms: All Bathrooms: All Lot Size: All
Property Types: Residential: (Single Family) Sq Ft: All
Cities: Frisco
Clarus MarketMetrics® 1 of 2 04/02/2011
Information not guaranteed. © 2009-2010 Terradatum and its suppliers and licensors (www.terradatum.com/about/licensors.td).
1 of 6
- 2. Valarie Littles Ultima Real Estate
Median For Sale vs. Median Sold
Mar-10 vs. Mar-11: The median price of for sale properties is up 0% and the median price of sold properties is down 0%
For Sale # Properties Sold # Properties Price
Time Period Median For Sale Median Sold Difference
Mar-11 289,999 1,269 244,000 138 -45,999
Feb-11 294,900 1,164 244,900 151 -50,000
Jan-11 295,000 1,201 247,950 110 -47,050
Dec-10 295,000 1,196 239,990 167 -55,010
Nov-10 289,500 1,305 275,000 141 -14,500
Oct-10 287,000 1,376 256,500 157 -30,500
Sep-10 284,950 1,416 262,000 136 -22,949
Aug-10 287,650 1,476 258,490 175 -29,160
Jul-10 289,000 1,467 282,000 191 -7,000
Jun-10 290,000 1,431 272,000 261 -18,000
May-10 299,900 1,350 242,900 275 -57,000
Apr-10 289,900 1,475 229,200 268 -60,700
Mar-10 289,000 1,415 245,000 229 -44,000
Clarus MarketMetrics® 2 of 2 04/02/2011
Information not guaranteed. © 2009-2010 Terradatum and its suppliers and licensors (www.terradatum.com/about/licensors.td).
2 of 6
- 3. Valarie Littles Ultima Real Estate
Supply & Demand by Month
Mar-10 vs. Mar-11: The number of for sale properties is down 10% and the number of sold properties is down 40%
Mar-10 vs. Mar-11 Mar-10 vs. Mar-11
Mar-10 Mar-11 Change % Mar-10 Mar-11 Change %
1,415 1,269 -146 -10% 229 138 -91 -40%
MLS: NTREIS Period: 1 year (monthly) Price: All Construction Type: All Bedrooms: All Bathrooms: All Lot Size: All
Property Types: Residential: (Single Family) Sq Ft: All
Cities: Frisco
Clarus MarketMetrics® 1 of 2 04/02/2011
Information not guaranteed. © 2009-2010 Terradatum and its suppliers and licensors (www.terradatum.com/about/licensors.td).
3 of 6
- 4. Valarie Littles Ultima Real Estate
Supply & Demand by Month
Mar-10 vs. Mar-11: The number of for sale properties is down 10% and the number of sold properties is down 40%
# Properties Average DOM # Properties Average DOM
Time Period For Sale For Sale Sold Sold
Mar-11 1,269 96 138 76
Feb-11 1,164 126 151 98
Jan-11 1,201 143 110 99
Dec-10 1,196 164 167 96
Nov-10 1,305 167 141 93
Oct-10 1,376 169 157 77
Sep-10 1,416 171 136 73
Aug-10 1,476 170 175 67
Jul-10 1,467 173 191 77
Jun-10 1,431 178 261 70
May-10 1,350 177 275 55
Apr-10 1,475 162 268 63
Mar-10 1,415 162 229 79
Clarus MarketMetrics® 2 of 2 04/02/2011
Information not guaranteed. © 2009-2010 Terradatum and its suppliers and licensors (www.terradatum.com/about/licensors.td).
4 of 6
- 5. Valarie Littles Ultima Real Estate
Months Supply of Inventory
Mar-10 vs. Mar-11: The average months supply of inventory is up 39%
Mar-10 vs. Mar-11
Mar-10 Mar-11 Change %
3.8 5.3 1.5 +39%
MLS: NTREIS Period: 1 year (monthly) Price: All Construction Type: All Bedrooms: All Bathrooms: All Lot Size: All
Property Types: Residential: (Single Family) Sq Ft: All
Cities: Frisco
Clarus MarketMetrics® 1 of 2 04/02/2011
Information not guaranteed. © 2009-2010 Terradatum and its suppliers and licensors (www.terradatum.com/about/licensors.td).
5 of 6
- 6. Valarie Littles Ultima Real Estate
Months Supply of Inventory
Mar-10 vs. Mar-11: The average months supply of inventory is up 39%
# Units For Sale # UC Units UC Average
Time Period Last Day of Month During Month MSI DOM
Mar-11 997 189 5.3 77
Feb-11 882 179 4.9 87
Jan-11 904 173 5.2 96
Dec-10 898 131 6.9 96
Nov-10 1,035 138 7.5 100
Oct-10 1,062 169 6.3 87
Sep-10 1,117 144 7.8 80
Aug-10 1,144 165 6.9 69
Jul-10 1,169 164 7.1 78
Jun-10 1,112 177 6.3 74
May-10 1,073 164 6.5 66
Apr-10 1,028 346 3.0 59
Mar-10 1,043 275 3.8 60
Clarus MarketMetrics® 2 of 2 04/02/2011
Information not guaranteed. © 2009-2010 Terradatum and its suppliers and licensors (www.terradatum.com/about/licensors.td).
6 of 6