More Related Content
Similar to Allen TX - Feb/March 2011 - Housing Market Report
Similar to Allen TX - Feb/March 2011 - Housing Market Report (18)
More from Valarie Littles
More from Valarie Littles (11)
Allen TX - Feb/March 2011 - Housing Market Report
- 1. Valarie Littles Ultima Real Estate
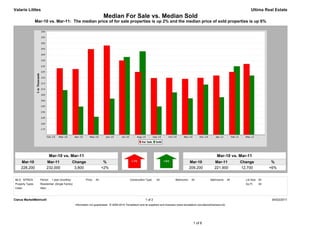
Median For Sale vs. Median Sold
Mar-10 vs. Mar-11: The median price of for sale properties is up 2% and the median price of sold properties is up 6%
Mar-10 vs. Mar-11 Mar-10 vs. Mar-11
Mar-10 Mar-11 Change % Mar-10 Mar-11 Change %
228,200 232,000 3,800 +2% 209,200 221,900 12,700 +6%
MLS: NTREIS Period: 1 year (monthly) Price: All Construction Type: All Bedrooms: All Bathrooms: All Lot Size: All
Property Types: Residential: (Single Family) Sq Ft: All
Cities: Allen
Clarus MarketMetrics® 1 of 2 04/02/2011
Information not guaranteed. © 2009-2010 Terradatum and its suppliers and licensors (www.terradatum.com/about/licensors.td).
1 of 6
- 2. Valarie Littles Ultima Real Estate
Median For Sale vs. Median Sold
Mar-10 vs. Mar-11: The median price of for sale properties is up 2% and the median price of sold properties is up 6%
For Sale # Properties Sold # Properties Price
Time Period Median For Sale Median Sold Difference
Mar-11 232,000 605 221,900 81 -10,100
Feb-11 225,000 533 230,000 67 5,000
Jan-11 221,900 545 203,000 66 -18,900
Dec-10 219,900 562 214,000 101 -5,900
Nov-10 219,000 638 202,000 67 -17,000
Oct-10 219,900 674 207,225 74 -12,675
Sep-10 219,700 676 195,000 71 -24,700
Aug-10 225,000 696 243,000 105 18,000
Jul-10 234,999 681 238,000 97 3,001
Jun-10 248,000 651 201,750 134 -46,250
May-10 244,900 613 186,000 151 -58,900
Apr-10 227,500 681 194,900 163 -32,600
Mar-10 228,200 652 209,200 124 -19,000
Clarus MarketMetrics® 2 of 2 04/02/2011
Information not guaranteed. © 2009-2010 Terradatum and its suppliers and licensors (www.terradatum.com/about/licensors.td).
2 of 6
- 3. Valarie Littles Ultima Real Estate
Supply & Demand by Month
Mar-10 vs. Mar-11: The number of for sale properties is down 7% and the number of sold properties is down 35%
Mar-10 vs. Mar-11 Mar-10 vs. Mar-11
Mar-10 Mar-11 Change % Mar-10 Mar-11 Change %
652 605 -47 -7% 124 81 -43 -35%
MLS: NTREIS Period: 1 year (monthly) Price: All Construction Type: All Bedrooms: All Bathrooms: All Lot Size: All
Property Types: Residential: (Single Family) Sq Ft: All
Cities: Allen
Clarus MarketMetrics® 1 of 2 04/02/2011
Information not guaranteed. © 2009-2010 Terradatum and its suppliers and licensors (www.terradatum.com/about/licensors.td).
3 of 6
- 4. Valarie Littles Ultima Real Estate
Supply & Demand by Month
Mar-10 vs. Mar-11: The number of for sale properties is down 7% and the number of sold properties is down 35%
# Properties Average DOM # Properties Average DOM
Time Period For Sale For Sale Sold Sold
Mar-11 605 91 81 96
Feb-11 533 118 67 99
Jan-11 545 137 66 83
Dec-10 562 153 101 79
Nov-10 638 154 67 76
Oct-10 674 153 74 59
Sep-10 676 155 71 60
Aug-10 696 156 105 65
Jul-10 681 154 97 63
Jun-10 651 152 134 58
May-10 613 156 151 60
Apr-10 681 141 163 63
Mar-10 652 142 124 68
Clarus MarketMetrics® 2 of 2 04/02/2011
Information not guaranteed. © 2009-2010 Terradatum and its suppliers and licensors (www.terradatum.com/about/licensors.td).
4 of 6
- 5. Valarie Littles Ultima Real Estate
Months Supply of Inventory
Mar-10 vs. Mar-11: The average months supply of inventory is up 87%
Mar-10 vs. Mar-11
Mar-10 Mar-11 Change %
2.5 4.6 2.1 +87%
MLS: NTREIS Period: 1 year (monthly) Price: All Construction Type: All Bedrooms: All Bathrooms: All Lot Size: All
Property Types: Residential: (Single Family) Sq Ft: All
Cities: Allen
Clarus MarketMetrics® 1 of 2 04/02/2011
Information not guaranteed. © 2009-2010 Terradatum and its suppliers and licensors (www.terradatum.com/about/licensors.td).
5 of 6
- 6. Valarie Littles Ultima Real Estate
Months Supply of Inventory
Mar-10 vs. Mar-11: The average months supply of inventory is up 87%
# Units For Sale # UC Units UC Average
Time Period Last Day of Month During Month MSI DOM
Mar-11 454 98 4.6 94
Feb-11 413 92 4.5 80
Jan-11 396 89 4.4 85
Dec-10 407 71 5.7 93
Nov-10 475 84 5.7 87
Oct-10 516 79 6.5 67
Sep-10 532 66 8.1 65
Aug-10 543 85 6.4 66
Jul-10 525 98 5.4 62
Jun-10 497 109 4.6 57
May-10 469 78 6.0 62
Apr-10 448 183 2.4 58
Mar-10 437 176 2.5 64
Clarus MarketMetrics® 2 of 2 04/02/2011
Information not guaranteed. © 2009-2010 Terradatum and its suppliers and licensors (www.terradatum.com/about/licensors.td).
6 of 6