More Related Content
Similar to Murphy TX - July 2010 Market Report
Similar to Murphy TX - July 2010 Market Report (15)
More from Valarie Littles
More from Valarie Littles (20)
Murphy TX - July 2010 Market Report
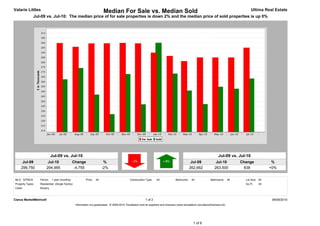
- 1. Valarie Littles Median For Sale vs. Median Sold Ultima Real Estate
Jul-09 vs. Jul-10: The median price of for sale properties is down 2% and the median price of sold properties is up 0%
Jul-09 vs. Jul-10 Jul-09 vs. Jul-10
Jul-09 Jul-10 Change % Jul-09 Jul-10 Change %
299,750 294,995 -4,755 -2% 262,662 263,500 838 +0%
MLS: NTREIS Period: 1 year (monthly) Price: All Construction Type: All Bedrooms: All Bathrooms: All Lot Size: All
Property Types: Residential: (Single Family) Sq Ft: All
Cities: Murphy
Clarus MarketMetrics® 1 of 2 08/08/2010
Information not guaranteed. © 2009-2010 Terradatum and its suppliers and licensors (www.terradatum.com/about/licensors.td).
1 of 6
- 2. Valarie Littles Median For Sale vs. Median Sold Ultima Real Estate
Jul-09 vs. Jul-10: The median price of for sale properties is down 2% and the median price of sold properties is up 0%
For Sale # Properties Sold # Properties Price
Time Period Median For Sale Median Sold Difference
Jul-10 294,995 128 263,500 20 -31,495
Jun-10 284,950 134 253,000 21 -31,950
May-10 285,000 122 255,000 25 -30,000
Apr-10 285,000 153 237,250 28 -47,750
Mar-10 281,250 152 251,100 21 -30,150
Feb-10 286,500 145 268,500 18 -18,000
Jan-10 289,900 129 300,000 7 10,100
Dec-09 299,450 111 237,000 17 -62,450
Nov-09 299,825 120 268,019 17 -31,806
Oct-09 299,500 126 227,000 19 -72,500
Sep-09 299,375 128 247,000 20 -52,375
Aug-09 295,900 145 274,250 28 -21,650
Jul-09 299,750 149 262,662.5 34 -37,088
Clarus MarketMetrics® 2 of 2 08/08/2010
Information not guaranteed. © 2009-2010 Terradatum and its suppliers and licensors (www.terradatum.com/about/licensors.td).
2 of 6
- 3. Valarie Littles Supply & Demand by Month Ultima Real Estate
Jul-09 vs. Jul-10: The number of for sale properties is down 14% and the number of sold properties is down 41%
Jul-09 vs. Jul-10 Jul-09 vs. Jul-10
Jul-09 Jul-10 Change % Jul-09 Jul-10 Change %
149 128 -21 -14% 34 20 -14 -41%
MLS: NTREIS Period: 1 year (monthly) Price: All Construction Type: All Bedrooms: All Bathrooms: All Lot Size: All
Property Types: Residential: (Single Family) Sq Ft: All
Cities: Murphy
Clarus MarketMetrics® 1 of 2 08/08/2010
Information not guaranteed. © 2009-2010 Terradatum and its suppliers and licensors (www.terradatum.com/about/licensors.td).
3 of 6
- 4. Valarie Littles Supply & Demand by Month Ultima Real Estate
Jul-09 vs. Jul-10: The number of for sale properties is down 14% and the number of sold properties is down 41%
# Properties Average DOM # Properties Average DOM
Time Period For Sale For Sale Sold Sold
Jul-10 128 88 20 52
Jun-10 134 102 21 68
May-10 122 129 25 87
Apr-10 153 129 28 53
Mar-10 152 137 21 94
Feb-10 145 137 18 72
Jan-10 129 159 7 102
Dec-09 111 172 17 61
Nov-09 120 169 17 42
Oct-09 126 161 19 65
Sep-09 128 167 20 82
Aug-09 145 160 28 70
Jul-09 149 156 34 67
Clarus MarketMetrics® 2 of 2 08/08/2010
Information not guaranteed. © 2009-2010 Terradatum and its suppliers and licensors (www.terradatum.com/about/licensors.td).
4 of 6
- 5. Valarie Littles Months Supply of Inventory Ultima Real Estate
Jul-09 vs. Jul-10: The average months supply of inventory is up 47%
Jul-09 vs. Jul-10
Jul-09 Jul-10 Change %
5.0 7.3 2.3 +47%
MLS: NTREIS Period: 1 year (monthly) Price: All Construction Type: All Bedrooms: All Bathrooms: All Lot Size: All
Property Types: Residential: (Single Family) Sq Ft: All
Cities: Murphy
Clarus MarketMetrics® 1 of 2 08/08/2010
Information not guaranteed. © 2009-2010 Terradatum and its suppliers and licensors (www.terradatum.com/about/licensors.td).
5 of 6
- 6. Valarie Littles Months Supply of Inventory Ultima Real Estate
Jul-09 vs. Jul-10: The average months supply of inventory is up 47%
# Units For Sale # UC Units UC Average
Time Period Last Day of Month During Month MSI DOM
Jul-10 102 14 7 74
Jun-10 96 24 4 57
May-10 91 13 7 101
Apr-10 99 42 2 85
Mar-10 115 23 5 54
Feb-10 120 19 6 69
Jan-10 99 18 6 83
Dec-09 89 8 11 87
Nov-09 90 16 6 68
Oct-09 94 21 4 50
Sep-09 100 12 8 60
Aug-09 102 29 4 78
Jul-09 114 23 5 84
Clarus MarketMetrics® 2 of 2 08/08/2010
Information not guaranteed. © 2009-2010 Terradatum and its suppliers and licensors (www.terradatum.com/about/licensors.td).
6 of 6