More Related Content
Similar to Heath TX - Housing Market Report - August 2010
Similar to Heath TX - Housing Market Report - August 2010 (14)
More from Valarie Littles
More from Valarie Littles (20)
Heath TX - Housing Market Report - August 2010
- 1. Valarie Littles Ultima Real Estate
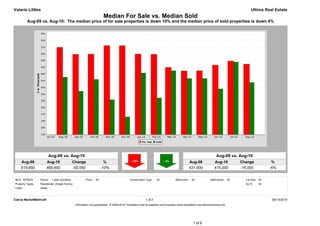
Median For Sale vs. Median Sold
Aug-09 vs. Aug-10: The median price of for sale properties is down 10% and the median price of sold properties is down 4%
Aug-09 vs. Aug-10 Aug-09 vs. Aug-10
Aug-09 Aug-10 Change % Aug-09 Aug-10 Change %
519,950 469,900 -50,050 -10% 431,000 415,000 -16,000 -4%
MLS: NTREIS Period: 1 year (monthly) Price: All Construction Type: All Bedrooms: All Bathrooms: All Lot Size: All
Property Types: Residential: (Single Family) Sq Ft: All
Cities: Heath
Clarus MarketMetrics® 1 of 2 09/13/2010
Information not guaranteed. © 2009-2010 Terradatum and its suppliers and licensors (www.terradatum.com/about/licensors.td).
1 of 6
- 2. Valarie Littles Ultima Real Estate
Median For Sale vs. Median Sold
Aug-09 vs. Aug-10: The median price of for sale properties is down 10% and the median price of sold properties is down 4%
For Sale # Properties Sold # Properties Price
Time Period Median For Sale Median Sold Difference
Aug-10 469,900 161 415,000 17 -54,900
Jul-10 479,000 181 476,200 12 -2,800
Jun-10 467,000 185 396,000 19 -71,000
May-10 449,900 171 427,000 9 -22,900
Apr-10 449,450 166 427,000 9 -22,450
Mar-10 459,900 151 450,000 9 -9,900
Feb-10 499,000 131 369,000 7 -130,000
Jan-10 499,900 133 443,500 9 -56,400
Dec-09 525,000 131 312,500 12 -212,500
Nov-09 525,000 143 363,750 8 -161,250
Oct-09 499,500 154 424,500 12 -75,000
Sep-09 499,000 160 388,950 18 -110,050
Aug-09 519,950 172 431,000 16 -88,950
Clarus MarketMetrics® 2 of 2 09/13/2010
Information not guaranteed. © 2009-2010 Terradatum and its suppliers and licensors (www.terradatum.com/about/licensors.td).
2 of 6
- 3. Valarie Littles Ultima Real Estate
Supply & Demand by Month
Aug-09 vs. Aug-10: The number of for sale properties is down 6% and the number of sold properties is up 6%
Aug-09 vs. Aug-10 Aug-09 vs. Aug-10
Aug-09 Aug-10 Change % Aug-09 Aug-10 Change %
172 161 -11 -6% 16 17 1 +6%
MLS: NTREIS Period: 1 year (monthly) Price: All Construction Type: All Bedrooms: All Bathrooms: All Lot Size: All
Property Types: Residential: (Single Family) Sq Ft: All
Cities: Heath
Clarus MarketMetrics® 1 of 2 09/13/2010
Information not guaranteed. © 2009-2010 Terradatum and its suppliers and licensors (www.terradatum.com/about/licensors.td).
3 of 6
- 4. Valarie Littles Ultima Real Estate
Supply & Demand by Month
Aug-09 vs. Aug-10: The number of for sale properties is down 6% and the number of sold properties is up 6%
# Properties Average DOM # Properties Average DOM
Time Period For Sale For Sale Sold Sold
Aug-10 161 149 17 126
Jul-10 181 155 12 113
Jun-10 185 172 19 117
May-10 171 187 9 109
Apr-10 166 194 9 70
Mar-10 151 212 9 93
Feb-10 131 234 7 41
Jan-10 133 242 9 112
Dec-09 131 255 12 173
Nov-09 143 255 8 116
Oct-09 154 251 12 143
Sep-09 160 249 18 145
Aug-09 172 241 16 90
Clarus MarketMetrics® 2 of 2 09/13/2010
Information not guaranteed. © 2009-2010 Terradatum and its suppliers and licensors (www.terradatum.com/about/licensors.td).
4 of 6
- 5. Valarie Littles Ultima Real Estate
Months Supply of Inventory
Aug-09 vs. Aug-10: The average months supply of inventory is up 52%
Aug-09 vs. Aug-10
Aug-09 Aug-10 Change %
8.7 13.2 4.5 +52%
MLS: NTREIS Period: 1 year (monthly) Price: All Construction Type: All Bedrooms: All Bathrooms: All Lot Size: All
Property Types: Residential: (Single Family) Sq Ft: All
Cities: Heath
Clarus MarketMetrics® 1 of 2 09/13/2010
Information not guaranteed. © 2009-2010 Terradatum and its suppliers and licensors (www.terradatum.com/about/licensors.td).
5 of 6
- 6. Valarie Littles Ultima Real Estate
Months Supply of Inventory
Aug-09 vs. Aug-10: The average months supply of inventory is up 52%
# Units For Sale # UC Units UC Average
Time Period Last Day of Month During Month MSI DOM
Aug-10 132 10 13.2 157
Jul-10 142 23 6.2 109
Jun-10 158 8 19.8 196
May-10 147 15 9.8 87
Apr-10 136 16 8.5 107
Mar-10 129 10 12.9 74
Feb-10 108 4 27.0 72
Jan-10 105 12 8.8 109
Dec-09 106 9 11.8 154
Nov-09 118 10 11.8 159
Oct-09 131 10 13.1 136
Sep-09 134 14 9.6 153
Aug-09 139 16 8.7 111
Clarus MarketMetrics® 2 of 2 09/13/2010
Information not guaranteed. © 2009-2010 Terradatum and its suppliers and licensors (www.terradatum.com/about/licensors.td).
6 of 6